- Research
- Open access
- Published:
A fast and accurate energy source emulator for wireless sensor networks
EURASIP Journal on Embedded Systems volume 2016, Article number: 18 (2017)
Abstract
The capability to either minimize energy consumption in battery-operated devices, or to adequately exploit energy harvesting from various ambient sources, is central to the development and engineering of energy-neutral wireless sensor networks. However, the design of effective networked embedded systems targeting unlimited lifetime poses several challenges at different architectural levels. In particular, the heterogeneity, the variability, and the unpredictability of many energy sources, combined to changes in energy required by powered devices, make it difficult to obtain reproducible testing conditions, thus prompting the need of novel solutions addressing these issues. This paper introduces a novel embedded hardware-software solution aimed at emulating a wide spectrum of energy sources usually exploited to power sensor networks motes. The proposed system consists of a modular architecture featuring small factor form, low power requirements, and limited cost. An extensive experimental characterization confirms the validity of the embedded emulator in terms of flexibility, accuracy, and latency while a case study about the emulation of a lithium battery shows that the hardware-software platform does not introduce any measurable reduction of the accuracy of the model. The presented solution represents therefore a convenient solution for testing large-scale testbeds under realistic energy supply scenarios for wireless sensor networks.
1 Introduction
Wireless sensor networks (WSNs) consist of a set of communicating nodes (motes) capable of sensing, processing, and storing physical quantities. One of the most critical issue in designing and developing WSNs is the limited amount of energy usually available in the nodes. The typical way of addressing this issue is by means of dynamic power management (DPM) strategies exploiting multiple low-power states of the motes. In such states, consumption drops from tens of milliwatts to a fraction of a microwatt increasing the system lifetime [1–3]. Recent advances in energy harvesting (EH) have introduced the opportunity of granting unbounded lifetime to sensor nodes, thus overcoming the limitations of battery-operated WSNs and introducing a new class of WSNs, called EH wireless sensor network (EH-WSNs), made of motes powered by renewable energy sources (RESs). This new opportunity has begun to shift the research paradigm from energy-constrained lifetime maximization (typical of battery-operated systems) to power-constrained workload maximization. EH motes can be deployed in remote environments and they can run potentially for an unlimited amount of time by gathering solar, kinetic, radio frequencies, or thermal energy [4, 5].
However, designing hardware and software solutions for EH-WSNs is a difficult task due to the main characteristics of RESs. In particular, RESs show a high degree of unpredictability while EH devices provide an extremely variable efficiency. In fact, the amount of energy harvested depends not only on environmental conditions, which can vary in a rapid and uncontrolled way, but also on the energy drawn at runtime by the powered device. The combination of these two main factors makes practically impossible to produce repeatable experiments while testing a EH-WSN hardware-software platform using traditional strategies. For instance, the same node with a particular hardware-software configuration can generate extremely different results while EH conditions change. Furthermore, even when it is possible to accurately reproduce in lab the behavior of an energy harvester, replicating it over a testing network of tens or hundreds of nodes can be unfeasible for complexity and economic reasons.
A viable alternative can be represented by simulating the network and the energy harvester to predict the behavior of motes possibly using real-world traces. In WSNs, the use of simulation has been deeply explored by several authors in the last ten years [6–12]. However, realistic simulation requires an accurate model not only of the EH device but also of every hardware component involved in the system plus a fast and accurate model of the communication channel. In fact, the actual energy efficiency of communication protocols in WSNs depends on many factors which are very difficult to model and simulate, like interferences, collisions, re-transmissions, and over-hearing. Handling these issues requires to trade off realism (and accuracy) for simulation time and complexity, so that accurate energy simulations of large WSNs is still to be regarded as an open research problem. Emulation provides a viable alternative.
In this paper, we present an embedded hardware-software platform implementing an energy source emulator capable to run different energy source models for WSNs. The general architecture of the emulator allows the designer to model any energy source and to connect it to any physical mote. The emulator adjusts the voltage levels of the power supply according to the model of choice, while also measuring the actual current drawn by the mote in order both to collect a trace, and to provide a real-time feedback to the energy source model. Models can be changed in the field either by loading them from the on-board non volatile memory or by uploading them through the network.
Finally, the small size of the platform (about 73×57 millimeters), together with its low cost (less than $50) and power consumption (about 100 mA at 12 V) make it ideal to be used in large testbeds.
In summary, the proposed system (i) represents a flexible solution for emulating a set of heterogeneous energy sources, targeting WSN motes’ power supply, (ii) provides a tunable level of realism through a model-agnostic architecture, and (iii) features low-power consumption levels, a small factor form and reduced production costs, which make it particularly suitable for emulation of many real-world application scenarios even in large prototyping testbeds.
Extensive characterization experiments confirm the validity of the proposed emulator both in terms of accuracy and in terms of computational performance. A representative case study regarding the emulation of a lithium battery shows that the hardware-software platform does not introduce any measurable reduction of the accuracy of the model.
The rest of the paper is organized as follows: Section 2 provides a survey of existing approaches to the energy source modeling and emulation; Section 3 provides a description of the proposed modeling framework; Section 4 presents the hardware-software emulation platform; Section 5 reports and discusses experimental results; Section 6 concludes the work.
2 Related work
2.1 Modeling
While the fastest and most accurate way to model an energy source is to sample (with the sampling rate determining the accuracy of the model) the I−V curve and store these samples on main memory, this approach cannot be implemented in embedded systems for most energy sources due to the high number of parameters which do not fit the main memory. In fact, the memory footprint of the model increases as O(n m+1), where n is the number of samples and m is the number of independent parameters.
A second approach, which has both memory footprint and execution time bounded by O(1), can be represented by analytically modeling the I-V curve. This approach is well suited for an embedded device providing a good trade-off between fast execution time, model accuracy, and memory footprint.
Moreover, there are mainly two methods used to create an analytic model of an energy source behavior: (i) curve fitting and (ii) modeling the equivalent circuit of the energy source.
Curve fitting is the process of interpolating a set of experimental data taken from the energy source’s I-V characteristic in a curve which approximates it. When this curve can be described analytically, evaluating it is significantly faster than interpolating at run-time a set of points.
An equivalent circuit model (ECM) is an ideal circuit which describes the energy source in terms of an ideal voltage (by applying Thevenin’s theorem) or current (using Norton’s theorem) generator and passive components. Solving the equivalent circuit by using Kirchhoff’s laws gives the energy source’s behavior in terms of tension and current (v(t) and i(t)). The I-V curve can be obtained by manipulating these two functions. Since solving the equivalent circuit requires to solve a system of differential equations, it might not be possible to obtain exact solutions.
Analytical models are often parameterized (e.g., a battery output voltage depends also on its internal resistance) and determining these parameters might take more effort than determining the I-V characteristic itself. In fact, while the I-V curve and parameters depending on the energy source itself can be determined once, before the emulation starts, parameters depending on environmental factors (e.g., temperature, incident light, and load resistance) require a new evaluation every time the parameter changes.
Some authors describe a direct relation between measured variables and I-V curve’s parameters (e.g., the I-V curve of a thermoelectric cell can be described as a function of heat absorbed by the cold side, temperature of the cold side and the slope of the experimental V(I) curve at Δ T=0), while others suggest an iterative approach (e.g., many models of solar panels try to fit the manufacturer I-V curve by varying iteratively a set of parameters of the ECM). The first approach can still be computed in O(1) while the second one depends on the approximation algorithm used and on the desired degree of accuracy.
2.2 Emulation
Despite its enormous potential, the energy source emulation for wireless sensor networks is a relatively unexplored field of research. Currently, there are several projects on designing emulation hardware for batteries and solar cells but only few contributions address the problem in a general way or are portable and intended for a massive distribution in a wide testbed.
For instance, B# [13] is a battery emulator based on an adjustable linear regulator which emulates the output battery voltages. It works in the range of 1.0–4.5 V and it can source a maximum current of 800 mA. The emulation board is controlled by means of a desktop computer running the Dualfoil electrochemical simulator for lithium-ion battery cells [14]. The main computer takes in input the current draw by the powered system and finds the corresponding voltage using a look-up table. S# [15] extends the B# architecture by adding a new front-end which allows the user to emulate a solar panel. In particular, S# can run either in the simulation mode or the emulation mode. In the simulation mode, it takes a current profile and a sunlight trace as inputs and generates a simulated power profile on the host computer. In the emulation mode, a real load is connected to the output of the emulation circuit and the solar model is written to the memory of the microcontroller which generates at run-time an appropriate voltage to drive the load. A similar approach is also presented by other authors which introduce solar panel emulation circuits controlled by means of a LabView PC [16–18].
The SunaPlayer photovoltaic emulator should be mentioned for its distinctive feature of using a Darlington transistor as the last circuit stage to build a non-linear model of a solar panel [19]. SunaPlayer is based on a microcontroller and can be battery powered. It supports a wide operating range, spanning output currents from 430 μA to 1.89 A and output voltages from 0.02 to 9.8 V with a measured accuracy of about 99 %. At run-time, the microcontroller needs to choose between several stored I-V curves in order to determine the appropriate tension value to be applied to the Darlington transistor gate. This task is very time expensive so that the major drawback highlighted by the authors is the extremely high latency which, in the worst case, has been measured in about 10 s.
Finally, in the photovoltaic domain, there are a plethora of emulators for high power (up to 3000 W) solar panels such as [20, 21] which are basically designed for industrial applications.
More close to a generic energy source emulator targeted for wireless sensor networks, we can report the Ekho project which is a generic energy harvesting emulator designed for small currents [22, 23]. In particular, Ekho uses a simple design where first of all each energy harvester needs to be characterized by recording its distinguishing I-V curves using a high-precision acquisition instrument. Then, the appropriate I-V curve is replayed at run-time by means of a dedicate board. The Ekho replaying board uses a capacitor to power the load and a sensing resistor (10 Ω) to estimate the supplied current. At run-time, the corresponding operating point on the I-V curve is calculated and the appropriate output tension is set. The system uses a FPGA to speed up the I-V calculation in the first release while the more recent implementation is based on a 32 Mhz ATMEL microcontroller. While the system shows a satisfactory emulation accuracy of about 77.4 μ A during a solar panel emulation its latency, measured in 7.4 ms, can negatively impair the ability to emulate a generic energy source for wireless sensor networks.
Another generic approach can be represented by the simulation/emulation framework described by De Mil et al. [24] where a generic energy harvester is simulated/emulated as a complex energy source which is composed by a harvester always connected to a energy storage such as an ultracapacitor. The energy harvester and the storage element are virtual, and implemented in software. The voltage drop across this virtual capacitor is calculated using a static model and a feedback is applied by means of a DAQ plus a voltage follower. Authors do not report accuracy or time latency but the entity of the microcontroller (a Texas Instrument MSP430 running up to 20 Mhz) reveals a high response time.
For reasons of completeness, a generic energy source emulator can also be represented by programmable power supplies such as those produced by National Instruments which are capable of simulating different energy sources with a wide range of operations [25]. These power supplies offer fine-grained measurement and a high degree of programmability but they are not portable and they can not be used in a massive installation because of their cost that exceeds $4000.
3 Modeling framework
The effective design of an embedded emulation device crucially depends on the capability of accurately and efficiently modeling the target energy source. In fact, the accuracy of the model impacts the capability of the emulator to mimic real-world sources, while the computational efficiency of the algorithm that implements the model directly affects the latency of the overall system and the possibility to emulate real time operating conditions.
A high-level abstraction of the modeling framework is provided in Fig. 1, which schematically represents the main functional blocks and relationships to be taken into account. In particular, the energy source can be summarized by means of the functional dependence of the produced output voltage from several input parameters:
-
t represents time;
Fig. 1 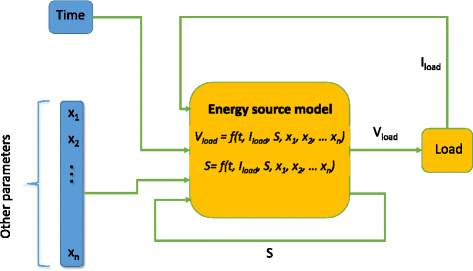
Modeling framework diagram
-
i load represents the current drained by the load at the given operating point;
-
x 1,x 2,⋯x n represent general parameters inherent to the modeled source (e.g., the solar irradiance and ambient temperature for a photovoltaic cell, the state of charge of a battery);
-
S represents the state of the system.

Modifications of the load impedance, for instance because of dynamic power management policies or, in general, because of different tasks performed by the powered system during its activity, result into changes of the load current. This variation, in turn, affects the output voltage provided by the source according to the functional relationship summarized by the current-voltage curve. This interplay can be represented by means of a loop through which the load current is fed back as input to the system. The other loop represented in Fig. 1 highlights the possibility of taking into account some form of memory, formalized by means of the state variable S in the diagram. For instance, when emulating a battery, the state of charge of the battery represents the state of the system whose current value clearly depends on the dynamic evolution up to the current time.
The adoption of such a general framework enables in principle to emulate any type of energy source, from batteries to renewable energy scavengers. To exemplify this concept, we introduce in the following some basic features of models which can be accommodated in the architecture of the proposed emulator. Needless to say, this brief excursus is far from being exhaustive. Other models of the same sources could be implemented, and other sources could be modeled within the presented framework, thus making the proposed emulator a flexible tool for system designers to emulate a wide range of different scenarios. However, it is worthwhile to notice that the aim of this work is not a thorough implementation and discussion of different energy source models, rather the description of the emulator architecture, including its experimental validation on specific case studies as provided in Section 5.
3.1 A battery model
Battery modeling is an active research area due to the widespread diffusion of battery-powered devices in several application fields. As a consequence, many possible methodologies and models are available [26]. Again, the exploration of this design space implies the evaluation of the trade-off between accuracy and computational complexity of the model. To evaluate the performance of the proposed emulator platform we implemented an analytical model suitable for rechargeable batteries of different types [27]. The methodology is based on curve fitting of the V(Q) discharge curve (at constant load) taken from the manufacturer’s datasheet.
The model discriminates between charge and discharge curves and describes them separately to take into account the fact that the I-V curve of a battery presents an hysteresis phenomenon. The discharge curve is described by a single equation valid for lead-acid, Li-ion and NiCd/NiMH batteries, while the charge curve is slightly different for each kind of battery. These curves are parameterized by maximum voltage, state of charge, internal resistance, polarization voltage, polarization resistance, instantaneous drawn current, and low-pass filtered current (which models the slow response of the battery to a change in load).
Every parameter but state of charge and current (both unfiltered and filtered1) can be obtained from a typical manufacturer’s datasheet by applying a set of equations on three points of the experimental discharge curve. The state of charge is computed as the drawn current integrated with respect to time. In order to reduce model complexity the authors make several assumptions, namely: battery capacity does not change at different discharge rate (no Peukert effect), no effect of temperature on the model, no memory effect, same parameters for both charge and discharge, constant internal resistance, and negligible self discharge.
This approach results into a model with the following features: (i) parameters can be easily derived (only three points are required) from the battery discharge curve or even from its datasheet; (ii) the computational complexity to evaluate the model is O(1), the most expensive operation being a single floating point exponentiation for the discharge I-V curve; (iii) maximum relative error on the I-V curve has been estimated to be 10 % in the worst case (state of charge of 0−20 % with highly dynamic load).
3.2 Energy harvesters
A generic energy harvester is typically composed of the following elements: (i) a transducer that transforms some form of energy available from the environment into electrical power; (ii) an energy buffer, used to provide energy storage capabilities to the system; (iii) an input regulator, which provides any signal conditioning (i.e., DC-AC, DC-DC conversion) required to adjust any mismatch between the operating range of the transducer and that if the buffer; (iv) an output regulator in charge of adapting the signal provided by the energy buffer to the operating range required by the load. Some components can be optionally included/excluded in the scheme described so far, in some cases. For instance, the scavenger could be directly coupled to the load without any buffering or output regulator, depending on the features of the target application.
To provide a more comprehensive view of the wide range of possible sources that can be implemented within the proposed architecture, we introduce in the following two models representative of a wide number of possible energy scavenging sources, namely photovoltaic and thermoelectric cells.
Solar cells exploit the photovoltaic effect (PV) to transform solar energy into electrical energy. The electrical power delivered by a PV panel (an array of interconnected solar cells) depends on several parameters, namely, solar radiance, incidence angle, working temperature, and load impedance. Different production technologies (monocrystalline, polycristalline, and amorphous silicon) result into different I-V curves, whose accurate modeling represents an issue to be addressed in order to gain insight about the amount of energy flow produced under different working conditions [28].
A common modeling approach entails the description of a PV module through an equivalent circuit with lumped components, the most commonly adopted being a circuit containing a current generator (accounting for the light generated current), a diode (used to shape the knee of a typical I-V characteristic), a series, and a shunt resistor (to account for connection losses). To fully characterize the working points of a cell, the extraction of parameters from these circuit representations is carried on by means of numerical nonlinear methods [28–30]. The computational requirements posed by these numerical models are critical for their implementation on embedded real-time systems. The inherent trade-off between convergence speed and accuracy of the emulated model is therefore an issue to be explored for the emulation of this type of energy source.
Thermoelectric cells (also known as thermoelectric generators, TEG for short) are devices capable of converting heat (given a thermal gradient across the plates) into electrical energy, exploiting the Seebeck effect. In particular, the voltage generated by a given cell is proportional to the temperature difference Δ T through a proportionality coefficient S (the Seebeck coefficient). The converse physical process may also be observed, namely, the heat transfer between the two sides of a TEG (Peltier effect). In order to design accurate models for analyzing both transient and steady conditions and encompassing non-linear electrical and thermal coupled effects, several methods have been proposed, leading to SPICE [31, 32] or Matlab/Simulink models [33, 34]. Other models, describing the interaction of a TEG with heat generated by CPUs (e.g., in a server farm monitoring application), have been derived by regression on the empirical relationship between temperature gradients and TEG output power (when the TEG is coupled to a DC-DC boost converter) [35]. Again, the complexity of computing the model output needs to be carefully evaluated, since it may severely affect its applicability in real-time environments and its implementation on embedded platforms. Moreover, circuit models need to take into account a model of the load to be powered, which might be particularly difficult to obtain in certain cases.
3.3 Compositional models
The proposed modeling framework allows to smoothly integrate and compose different building blocks representative of a cascade of devices. Indeed, in some applications, the energy flow provided by a given harvester needs to be properly shaped for compatibility with the load to be powered. For example, voltage limiters or output stage regulators (DC-DC converters) could be used to couple a photovoltaic scavenger to an embedded device equipped with integrated circuits requiring to be powered with stable voltage [28]. Another example could be represented by chips used to drive battery recharging according to optimized policies [36]. The composition of the I-V curves of each single block into a suitable I-V characteristic representative of the whole cascade allows us to emulate modular scavenging systems, providing a twofold benefit: on the one side we extend the emulation process to a wider spectrum of possible power source behaviors, on the other side we decouple and isolate the contribution of each single block (e.g. the photovoltaic cell and the recharge chip are separately characterized and composed) thus enabling to perform significant fine-grain emulations.
4 The energy emulator
In this paper, we present an hardware-software embedded device which can be used to emulate an energy source for wireless sensor nodes. The device, hereafter called emulator, is built starting from off-the-shelf hardware components on top of which it is possible to run different energy source models thanks to a dedicated software layer.
The main idea of the energy source emulation is to control the voltage and the current supplied to the powered device by means of a digital system in an attempt to follow a modeled energy source. A possible architecture capable to digitally control the voltage and the current supplied to a generic load can be represented by a system which continuously measures the supplied current and immediately acts in feedback to the generated voltage following any predefined policy. To this purpose in our emulator prototype a main microcontroller equipped with both and ADC, which measures the supplied current, and a DAC, used to impose a particular output voltage, has been used.
4.1 Hardware
Figure 2 shows an actual picture of the emulator prototype which highlights its relative small size (73 ×57 mm) while Fig. 3 shows the main architectural characteristics. The emulator core consists of the ATSAM4E16E microcontroller provided by Atmel corporation which is based on a high-performance 32-bit ARM®;Cortex®;-M4 RISC processor running at a maximum speed of 120 MHz and features up to 1024 kB of Flash and 128 kB of RAM [37].

Actual picture of the emulator prototype with highlighted its small dimensions (73 ×57 mm)

Schematic representation of the energy source emulator
This microcontroller family offers a rich set of advanced connectivity peripherals including an Ethernet port, a full-speed USB, and an high-speed MCI for SD and MMC memories. From the analog point of view, the microcontroller is equipped with two 16-bit ADC, one 12-bit DAC (2-channels), and an analog comparator which allow us to build the emulation interface described later in Section 4.2. The power supply unit consists of two low-dropout (LDO) voltage regulators designed to provide up to 1.5-A output current which receive the power through the ethernet connector using the Power over Ethernet (PoE) standard technology [38, 39]. Moreover, a precise analog reference has been provided to the microcontroller by means of an LM4132 precision voltage references chip in order to provide stable and accurate analog measures [40].
4.2 The emulation interface
The emulation interface refers to the particular schema and components used to build a complete feedback system starting from the microcontroller. In particular, Fig. 4 shows the adopted emulation interface which powers a generic sensor node represented into the right by a dashed rectangle. The DAC of the microcontroller can output a voltage signal with 12-bits of resolution mapped into an analog range starting from \(\frac {1}{6}\)ADVREF up to \(\frac {5}{6} \text {ADVREF}]\). Because of the standard power supply voltage of several consumer devices is 3.3 V which corresponds to our ADVREF, the A 1 operational amplifier (MAX4239) is provided to boost the DAC output (DACCout) to 3.3-V level [41]. Moreover, the boosted DAC output is used to drive the A 2 (AD8397) operational amplifier which is working as a voltage buffer and decouples the supplied current from the DAC output signal [42].

The current emulation interface powering a generic sensor node
In order to measure the current supplied to the generic load, a resistor (R sense) has been placed between the load and the ground and the resulting voltage drop (V sense) is amplified by A 3 (MAX4239) and then measured by an ADC channel. R sense has been opportunely dimensioned to obtain a good compromise between the current measurement resolution and the voltage drop which unavoidably affects the voltage perceived by the generic load. In particular, in our tests we use a sensing resistor of 6.22 Ω and a precision differential amplifiers with a gain of 10 [43]. Thus, for a value of 3.3 V (the max readable value for the ADC), we obtain a measurable current in the range from about 0.05 up to about 53 mA (considering a resolution of the ADC set to 16 bits).
Due to the voltage drop across the sensing resistor, a generic load is supplied by a voltage difference (V load) which is reduced with respect to the boosted DAC output imposed by the emulator. In order to compensate this reduction, a nominal voltage restoring mechanism has been implemented which consists on overloading the output of the DAC by the same voltage drop measured on the R sense as soon as the voltage drop has been read. This hardware-software loop guarantees a V load compliant to the nominal expected conditions with a delay equal at least to the hardware-software latency.
Finally, a second ADC channel (ADC V ) has been used to constantly monitor the real output value of the voltage buffer (A 2) for debugging purpose.
4.3 Software
The software architecture has been designed to achieve high performance and at the same time to allow the execution of different source models. Moreover, the emulator firmware has been developed to simplify the simulation parameter initialization and management in real conditions of utilization.
The software architecture has been designed in a modular way to guarantee the easy maintenance and the reuse of the source code. In particular, the overall architecture can be represented by the following six elements: (i) processor; (ii) communication; (iii) measuring; (iv) model; (v) output; (vi) data storage.
The processor element consists of the main loop function which manages the remaining elements. The main function loop iterates at the maximum achievable speed while executing the main instruction chain. In particular, at each iteration, a communication element, which is designed to manage the emulator via Telnet, is polled to handle potential incoming ethernet packets. If no commands have been issued by the Telnet channel a start measuring command is triggered to the measuring element. When the measure has been completed, the control is passed to the model element which executes the current model and produces output values. The calculated output values are then passed to the output element which properly configures the DAC output also including the nominal voltage restoring mechanism described in the previous section. Finally, a data storage element is also provided to optionally log system events and emulation data to an external SD memory card.
The main loop contained in the processor element is the major contributor to the emulator performance.
In fact, each stage of the loop is executed sequentially because of the single execution unit provided by the microcontroller so that the delay of each element is added to the others. For this reason, minimizing the execution time of each element is a crucial task which directly impacts the emulator performance. The optimization of the execution time of the element containing the energy source models should be treated separately since there is a trade-off between computational complexity and accuracy of each model which can impacts the emulator performance in different ways. This treatment is out of the scope of this paper and it will be discussed in a future work.
Basically, the period of time that elapses between two consecutive measurements is a phase in which the emulator is insensible to the variations of the supplied current and it can not react by setting a proper output value. This period of time can be named emulator latency and it should be minimized and properly characterized. In order to reduce the emulator latency, several expedients have been played out, such as disabling configuration Telnet commands when the emulation is running, or selecting among different level of the logger verbosity in order to reduce the time spent to save data to the SD card.
5 Experimental results
This section reports and discusses the results of extensive experiment and measurements performed on the emulator prototype described in the previous section. In order to provide a comprehensive characterization of the proposed system, two types of experiments have been conceived. The first set of experiments provides a characterization independent from the type of energy source emulated and is aimed at the following: (i) evaluating the accuracy of the emulator when it measures the current supplied to the load device; (ii) empirically characterizing the latency of the emulation platform. The second set of experiments concerns a real-world energy source emulation, namely, a battery discharge process which is taken as a representative case study of the emulation capabilities of the system.
In particular, Section 5.1 outlines the experimental setup, Section 5.2 reports the characterization of the error obtained during current measurement, Section 5.3 describes the measured emulator latency, while Section 5.4 shows the results obtained while emulating the discharge of a 550-mAh lithium battery.
5.1 Experimental setup
The current consumption of the device powered by the emulator was measured and sampled by means of a National Instruments PXI-4071 digital multimeter with a sensitivity down to 1 pA [44] while digital waveforms were sampled by means of a National Instruments NI-DAQmx PCI-6251 16-channel data acquisition board connected to a BNC-2120 shielded connector block [45, 46]. Square waves were produced using a TG2000 Aim-TTi analogue and digital function generators [47]. During the experiments, the emulator prototype was powered at 12 V by a NGMO2 Rohde & Schwarz dual-channel power supply [48]. The emulator was tested with constant load by connecting it to simple static resistors while an ad-hoc designed DC electronic load was used in constant current experiments. Finally, more realistic operating conditions have been experimented by using the emulator as a power source for a real VirtualSense sensor node [49].
5.2 Supplied current measurement error
The first set of experiments was carried out to deeply characterize the capability of the emulator to measure the current supplied to the powered device. For this purpose the emulator was programmed to generate a constant output in terms of voltage and, at the same time, to measure the supplied current. Understanding the capability to measure the supplied current is crucial because an error on its determination will introduce an obvious approximation on the model computation which results on a gap between emulation and reality regardless of the approximation of the implemented model.
The measurement error of the supplied current essentially derives from two different factors: (i) the characteristics of the ADC integrated into the microcontroller unit and (ii) the noise, introduced by the analog circuit which amplifies the signal collected from the sensing resistor (R sense in Fig. 4). While the ADC channel performance is well known and documented by the microcontroller manufacturer, the amplifier circuit should be properly characterized together with the ADC coupling.
Figure 5 shows the measurement error obtained while measuring the current supplied by the emulator to constant loads powered at different voltages. In particular, a set of resistors, with different values of resistance, were connected to the emulator output and the corresponding current flowing into the circuit has been measured, at the same time, with the high sensitivity digital multimeter and with the emulator sensing circuit. The difference between the real current (the current measured with the high sensitivity multimeter) and the current measured by the emulator prototype is reported on the figure for different current level obtained, both changing the resistor load, that changing the voltage supply level. As expected, the error increases while the supplied current increases, and it shows an absolute error ranging from about 0.05 to about 1.3 mA which can be considered satisfactory for an embedded device. However, the particular distribution of the measured errors suggests a strong predictability and repeatability, also confirmed by the high coefficient of determination (about 0.993) obtained while fitting this error distribution using a linear model (the black solid line in Fig. 5).

Error obtained while self-measuring the current supplied by the emulator to constant loads powered at different voltages
Thanks to the high confidence of the linear fitting described above an error compensation based on the regression curve has been introduced in order to increase the current measurement accuracy. In particular, Fig. 6 shows the percentage of error in current estimation, obtained while varying a resistive load supplied at 3 V, with the error compensation mechanism both enabled and disabled. Notice that for each resistive load the compensation mechanism decreases the measurement error which, in the worst case, does not exceed 7 %, for a measured current of about 300 μA, against about 24 % without the error compensation.

Percentage of error in current estimation obtained while varying the resistive load with and without the error compensation mechanism
The last set of experiments has been carried out to investigate the capability of the emulator to measure the supplied current to a highly variable load. A VirtualSense sensor node, which was sensing the radio channel for incoming packets and blinking a led, has been powered at a constant voltage of 3.3 V by means of the emulator prototype [49]. Figure 7 contains the waveforms of the supplied current collected by the emulator, with and without the error compensation mechanism, compared with that collected by the National Instruments PXI-4071 digital multimeter. As expected the uncompensated curve (the blue line) underestimates the real supplied current (the black line) while the compensated ones (the red line) is almost coinciding. The emulator collected curves also denote that rapid state transitions, such as a channel clear assessment (CCA), which determine a rapid increase in the current consumption, have been appropriately sampled end measured (see the zoomed curve plotted in the rectangle of Fig. 7).

Waveforms of the supplied current collected by the emulator with and without the error compensation mechanism compared with that collected by the digital multimeter
5.3 Latency estimation
The emulator latency has been accurately characterized by means of a set of dedicated experiments. In particular the goal of these experiments was the measurement of the minimum latency without considering the contribution of any particular model. The minimum latency can be measured by taking into account the time that elapses between a variation of the load, which determines a variation of V load due to a different current flowing through the R sense (see Fig. 4), and the restoring of the nominal condition by means of the emulator nominal voltage restore mechanism.
To accurately measure this time, the emulator was connected to a static resistive load which was instantly changed by means of an electromechanical relay which switches between two different resistor. The relay was driven by a square wave generated through the TG2000 Aim-TTi digital function generators [47]. Figure 8 shows four different plots illustrating the results of the latency measurements. In particular, the black line represents the current drawn through the load which instantly decreases from 28 to 15 mA as the result of the relay activation, while the value of the V load, the blue line in the figure, grows accordingly until the emulator restores the nominal condition. The figure also shows a square wave (the red line) which represents the start and the end of the reading of V sense by means of the ADC channel. In particular, the rising edge corresponds to the start of the reading procedure while the falling edge is the end of it. As soon as the emulator finishes reading the V sense value it applies the new DACCout value to neutralize the effect of the voltage drop on R sense. Therefore, starting from the plot of Fig. 8, the latency can be measured by taking into account the two points of variation of the V load. The four plots of the figure show four different conditions which lead to different latency values. In particular, the subplot (a) represents the worst case in which the ADC reading starts just few microseconds before the relay activation, so that we need to wait the succeeding ADC reading to realize the variation in the V sense. In this case, the measured latency is about 210 μs while it decreases in plots (b), (c), and (d) due to the different relative positions between the relay activation and the ADC reading. For instance, the (d) plot represents the best case, which is due to the perfect synchronization between the relay activation and the ADC reading, with a latency of only about 145 μs. In conclusion, given the peculiarity of the described mechanism, the emulator latency can be estimated as an average value between the four represented conditions which lead to an average latency of about 172 μs.

Latency measurement results. In a, the ADC reading starts just few microseconds before the current variation. In this case, the measured latency is about 210 μs while it decreases in plots b, c, and d due to the different relative positions between the current variation and the ADC reading
5.4 Emulating a battery discharge
As a case study to support the suitability of the proposed platform in emulating an energy source for wireless sensor networks, the battery model proposed by Tremblay and Dessaint has been implemented and tested on the emulator [27].
In particular, in a first set of experiments a real 550-mAh lithium battery has been discharged through an electronic load at a constant rate of 24 mA and the so obtained discharge curve has been used to obtain the model parameters. The emulator running the battery model has been initialized using the measured parameters and then connected to the same electronic load to emulate the battery discharge. Figure 9 shows the comparison between the real discharge curve and the corresponding curves obtained by the emulator with and without the error compensation mechanism. In particular, the real discharge curve (the black line in the figure) shows a typical lithium battery discharge behavior with a discharge time of about 24 h and 28 min, while the emulated battery (the red line in the figure) exhausts its charge in about 24 h and 5 min. The uncompensated experiment, as expected, suffers of the underestimation of the supplied current so that the emulated battery needs about 25 h and 12 min to discharge itself.

Comparison between the real battery discharge curve and the corresponding curves obtained by the emulator with and without the error compensation mechanism
In order to increase realism to the testing conditions, the emulated battery has been used to power a VirtualSense node which has been programmed to continuously send broadcast packets to the wireless channel. During the execution, VirtualSense passes from a current consumption of about 24 mA, which corresponds to a packet transmission, to about 10 μA in the standby state, in few milliseconds. Figure 10 shows the real discharge curve (the black line) obtained by powering VirtualSense by means of a 550-mAh lithium battery compared with the emulated discharge curve. The real battery took about 31 h and 15 min to completely discharge while the emulated battery sustained the VirtualSense activity only for about 29 h and 43 min resulting in a gap of about 1 h and 32 min. Despite the sizable gap between the real and the emulated battery, the obtained results are completely in line with the performance of the battery model which declares an average error of about 10 %.

Comparison between the discharge curve of a 550 mAh lithium battery and the emulated curve. The discharge has been made by powering a VirtualSense node programmed to continuously send broadcast packets to the wireless channel
6 Conclusions
The design of effective networked embedded systems powered by energy harvesters poses several challenges at different architectural levels due to the variability and the unpredictability of the energy sources combined with the non-linear behavior of the powered devices. The combination of these two main factors makes it difficult to obtain reproducible testing conditions, thus prompting the need of novel solutions addressing these issues.
In this paper, we present a novel embedded hardware-software platform implementing an energy source emulator capable to run different energy source models for WSNs. The proposed device is characterized by a portable low-power, low-cost modular architecture that provides designers with a realistic, flexible, and repeatable testing solution.
Extensive experimental characterization confirms the validity of the proposed embedded emulator both from the accuracy point of view, showing a supplying current error which, in the worst case, does not exceed 7 %, and from the latency point of view which has been estimated on about 172 μs. Realistic experiments conducted on a representative case study regarding the emulation of a lithium battery demonstrate that the hardware-software platform does not introduce any measurable reduction of the accuracy of the implemented model.
7 Endnotes
1 The manufacturer does not give information which can be used to determine the cutoff frequency of the filter, but it has been determined experimentally to be about 1/30 Hz.
References
A Bogliolo, E Lattanzi, V Freschi, in ENSSys ’13: Proceedings of the 1st International Workshop on Energy Neutral Sensing Systems. Idleness as a resource in energy-neutral WSNs (ACMNew York, 2013), pp. 1–6.
A Bogliolo, V Freschi, E Lattanzi, AL Murphy, U Raza, in Proceedings of 9th IEEE International Symposium on Industrial Embedded Systems, SIES 2014. Towards a true energetically sustainable WSN: a case study with prediction-based data collection and a wake-up receiver (IEEENew York, 2014), pp. 21–28.
U Raza, A Bogliolo, V Freschi, E Lattanzi, AL Murphy, A two-prong approach to energy-efficient WSNs: wake-up receivers plus dedicated, model-based sensing. Ad Hoc Netw. 45:, 1–12 (2016).
JA Paradiso, T Starner, Energy scavenging for mobile and wireless electronics. IEEE Pervasive Comput. 4(1), 18–27 (2005).
S Basagni, MY Naderi, C Petrioli, D Spenza, in Mobile Ad Hoc Networking: Cutting Edge Directions, Second Edition, ed. by S Basagni, M Conti, S Giordano, and I Stojmenovic. Wireless Sensor Networks with Energy Harvesting (WileyHoboken, 2013), pp. 701–736.
A Kansal, MB Srivastava, in Low Power Electronics and Design, 2003. ISLPED’03. Proceedings of the 2003 International Symposium On. An environmental energy harvesting framework for sensor networks (IEEENew York, 2003), pp. 481–486.
P Levis, N Lee, M Welsh, D Culler, in Proceedings of the 1st International Conference on Embedded Networked Sensor Systems. SenSys ’03. Tossim: accurate and scalable simulation of entire TinyOS applications (ACMNew York, 2003), pp. 126–137. http://doi.acm.org/10.1145/958491.958506.
F Österlind, A sensor network simulator for the contiki OS. Swedish Institute of Computer Science SICS Report (2009).
A Sobeih, JC Hou, L-C Kung, N Li, H Zhang, W-P Chen, H-Y Tyan, H Lim, J-sim: a simulation and emulation environment for wireless sensor networks. IEEE Wirel. Commun. 13(4), 104–119 (2006).
D Dondi, A Bertacchini, D Brunelli, L Larcher, L Benini, Modeling and optimization of a solar energy harvester system for self-powered wireless sensor networks. IEEE Trans. Ind. Electron. 55(7), 2759–2766 (2008).
GV Merrett, NM White, NR Harris, BM Al-Hashimi, in Sensor, Mesh and Ad Hoc Communications and Networks, 2009. SECON’09. 6th Annual IEEE Communications Society Conference On. Energy-aware simulation for wireless sensor networks (IEEENew York, 2009), pp. 1–8.
S Climent, A Sanchez, S Blanc, JV Capella, R Ors, Wireless sensor network with energy harvesting: modeling and simulation based on a practical architecture using real radiation levels. Concurr. Comput. Pract. Exper.28:, 1812–1830 (2016).
PH Chou, C Park, J Park, K Pham, J Liu, in Proceedings of the 2003 International Symposium on Low Power Electronics and Design. B#: a battery emulator and power profiling instrument (ACMNew York, 2003), pp. 288–293.
M Doyle, T Fuller, J Newman, Modeling of galvanostatic charge and discharge of the lithium/ polymer/insertion cell. J. Electrochem. Soc.140(6), 1526–1533 (1993).
D-J Li, PH Chou, in Low Power Electronics and Design, 2004. ISLPED’04. Proceedings of the 2004 International Symposium On. Maximizing efficiency of solar-powered systems by load matching (IEEENew York, 2004), pp. 162–167.
Y Atia, M Zahran, A Al-Hossain, Solar cell emulator and solar cell characteristics measurements in dark and illuminated conditions. WSEAS Trans Syst. Control. 6(4), 125–135 (2011).
W Lee, Y Kim, Y Wang, N Chang, M Pedram, S Han, in Proceedings of the International Symposium on Low Power Electronics and Design. Versatile high-fidelity photovoltaic module emulation system (IEEENew York, 2011), pp. 91–96.
S Thale, R Wandhare, V Agarwal, in Photovoltaic Specialist Conference (PVSC), 2014 IEEE 40th. A novel low cost portable integrated solar pv, fuel cell and battery emulator with fast tracking algorithm (IEEENew York, 2014), pp. 3138–3143.
S Bobovych, N Banerjee, R Robucci, JP Parkerson, J Schmandt, C Patel, in Proceedings of the 14th International Conference on Information Processing in Sensor Networks - IPSN ’15. SunaPlayer (ACM PressNew York, 2015), pp. 59–70. http://dl.acm.org/citation.cfm?doid=2737095.2737110.
C-C Chen, H-C Chang, C-C Kuo, C-C Lin, Programmable energy source emulator for photovoltaic panels considering partial shadow effect. Energy. 54:, 174–183 (2013).
R González-Medina, I Patrao, G Garcerá, E Figueres, A low-cost photovoltaic emulator for static and dynamic evaluation of photovoltaic power converters and facilities. Prog. Photovolt. Res. Appl. 22(2), 227–241 (2014).
H Zhang, M Salajegheh, K Fu, J Sorber, in Proceedings of the 4th Workshop on Power-Aware Computing and Systems - HotPower ’11. Ekho: bridging the gap between simulation and reality in tiny energy-harvesting sensors, (2011), pp. 1–5. http://dl.acm.org/citation.cfm?doid=2039252.2039261. Accessed Sept 2016.
J Hester, T Scott, J Sorber, in Proceedings of the 12th ACM Conference on Embedded Network Sensor Systems - SenSys ’14. Ekho: realistic and repeatable experimentation for tiny energy-harvesting sensors, (2014), pp. 1–15. http://dl.acm.org/citation.cfm?doid=2668332.2668336. Accessed Sept 2016.
P De Mil, B Jooris, L Tytgat, R Catteeuw, I Moerman, P Demeester, A Kamerman, Design and implementation of a generic energy-harvesting framework applied to the evaluation of a large-scale electronic shelf-labeling wireless sensor network. EURASIP J. Wirel. Commun. Netw. 2010:, 7:1–7:12 (2010).
Source Measure Unit. Natl. Instrum. http://www.ni.com/pdf/products/us/cat_Ni_4130.pdf. Accessed 23 June 2016.
M Petricca, D Shin, A Bocca, A Macii, E Macii, M Poncino, in IEEE International Symposium on Low Power Electronics and Design (ISLPED), 2013. An automated framework for generating variable-accuracy battery models from datasheet information (IEEENew York, 2013), pp. 365–370.
O Tremblay, L-A Dessaint, Experimental validation of a battery dynamic model for EV applications. World. Electric. Veh. J. 3(1), 1–10 (2009).
D Brunelli, D Dondi, A Bertacchini, L Larcher, P Pavan, L Benini, Photovoltaic scavenging systems: modeling and optimization. Microelectron. J. 40(9), 1337–1344 (2009).
S Bal, A Anurag, M Nanda, S Sourav, Comprehensive analysis and experimental validation of an improved mathematical modeling of photovoltaic array. Adv. Power Electron. 2015: (2015).
K Ishaque, Z Salam, H Taheri, Simple, fast and accurate two-diode model for photovoltaic modules. Sol. Energy Mater. Sol. Cells. 95(2), 586–594 (2011).
M Chen, LA Rosendahl, TJ Condra, JK Pedersen, Numerical modeling of thermoelectric generators with varing material properties in a circuit simulator. IEEE Trans. Energy Convers. 24(1), 112–124 (2009).
S Kim, Analysis and modeling of effective temperature differences and electrical parameters of thermoelectric generators. Appl. Energy. 102:, 1458–1463 (2013).
H-L Tsai, J-M Lin, Model building and simulation of thermoelectric module using MATLAB/Simulink. J. Elec. Materi. 39(9), 2105–2111 (2010).
A Montecucco, AR Knox, Accurate simulation of thermoelectric power generating systems. Appl. Energy. 118:, 166–172 (2014).
M Rossi, L Rizzon, M Fait, R Passerone, D Brunelli, Energy neutral wireless sensing for server farms monitoring. IEEE J. Emerg. Sel. Top. Circ. Syst. 4(3), 324–334 (2014).
USB-Friendly Li-Ion Battery Charger and Power-Path Management IC, Vout 200mV Above Vbat. Tex Instrum. http://www.ti.com/product/bq24072?qgpn=bq24072. Accessed 20 June 2016.
Atmel SMART ARM-based Flash MCU, Atmel Corporation. http://www.atmel.com/devices/ATSAM4E16E.aspx. Accessed 10 May 2016.
5V Micropower Low-Dropout Voltage Regulator. Tex. Instrum. http://www.ti.com/product/LP2954. Accessed 10 May 2016.
1.5A Low Dropout Positive Regulators. Linear Technol. http://www.linear.com/product/LT1086. Accessed 10 May 2016.
Precision Low Dropout Voltage Reference. Tex. Instrum. http://www.ti.com/product/LM4132. Accessed 10 May 2016.
Ultra-Low Offset/Drift, Low-Noise, Precision SOT23 Amplifiers. Maxim Integr. https://www.maximintegrated.com/en/datasheet/index.mvp/id/3407. Accessed 11 May 2016.
Rail-to-Rail, High Output Current Amplifier. Analog Devices. http://www.analog.com/media/en/technical-documentation/data-sheets/AD8397.pdf. Accessed 11 May 2016.
Micropower, Single-Supply, Rail-to-Rail Precision Differential Amplifiers. Maxim Integr. https://www.maximintegrated.com/en/products/analog/amplifiers/MAX4199.html. Accessed 11 May 2016.
PXI-4071 Datasheet. Natl. Instrum. http://www.ni.com/pdf/products/us/cat_NIPXI4071.pdf. Accessed 10 May 2016.
PC-6251 Datasheet. Natl. Instrum. http://sine.ni.com/nips/cds/print/p/lang/en/nid/14124. Accessed 10 May 2016.
BNC-2120 Datasheet. Natl. Instrum. http://sine.ni.com/nips/cds/view/p/lang/en/nid/10712. Accessed 10 May 2016.
TG, 2000 Datasheet. Aim i-TT. http://www.aimtti.com/sites/default/files/brochure/gen-tg1000_2000-4p_0.pdf. Accessed 10 May 2016.
NGMO, 2 Datasheet. Rohde & Schwarz. http://www.rohde-schwarz.it/file_1800/ngmo2_21_web-LF.pdf. Accessed 10 May 2016.
E Lattanzi, A Bogliolo, Virtualsense: a java-based open platform for ultra-low-power wireless sensor nodes. Int. J. Distrib. Sensor Netw. 2012:, 16 (2012). Article ID 154737.
Competing interests
The authors declare that they have no competing interests.
Author information
Authors and Affiliations
Corresponding author
Rights and permissions
Open Access This article is distributed under the terms of the Creative Commons Attribution 4.0 International License (http://creativecommons.org/licenses/by/4.0/), which permits unrestricted use, distribution, and reproduction in any medium, provided you give appropriate credit to the original author(s) and the source, provide a link to the Creative Commons license, and indicate if changes were made.
About this article

Cite this article
Lattanzi, E., Freschi, V., Dromedari, M. et al. A fast and accurate energy source emulator for wireless sensor networks. J Embedded Systems 2016, 18 (2017). https://doi.org/10.1186/s13639-016-0055-5
Received:
Accepted:
Published:
DOI: https://doi.org/10.1186/s13639-016-0055-5