- Research
- Open access
- Published:
A low-power wireless system for energy consumption analysis at mains sockets
EURASIP Journal on Embedded Systems volume 2017, Article number: 8 (2017)
Abstract
Introduction
Improving energy efficiency and reducing energy wastage is an important topic of our time. But it is quite difficult to figure out how much of our total electricity bill can be mapped to which device or at what time the device used it. We believe energy efficiency of normal households can be improved, if this kind of transparency would be available. In this article, we present a system for energy measurement at mains sockets to gain a transparent view of energy consumption for each device in a household. It consists of several smart energy measuring devices (SEMDs) that use a low-power radio protocol to dynamically build and connect to a radio network to transfer power usage date to a server. At the server, the data is stored and can be accessed via web interface.
Results
Our primary goal was to build a back-end system for an energy metering platform with very low energy consumption. This platform can provide data for a variety of services that enables users (the consumers) to understand and improve their energy consumption behavior and increase overall energy efficiency of their households.
1 Introduction
The transition, from conventional centralized energy feed-in, to decentralized regenerative energy supply is one of the defining challenges of our time and provides many challenges. Contrary to coal, oil, or nuclear power plants, renewable energy generators and thereby renewable energy itself have some disadvantages [1]. One would be that much of the renewable energy like photovoltaic or wind power cannot be produced on demand easily [2]. Depending on environmental conditions, the amount of available energy may vary, thereby producing an energy surplus or shortage to demand. Another thing is that the amount of energy produced by renewable energy generators is low in comparison to huge conventional nuclear, coal, oil, or gas power plants. With these restrictions in mind, maintaining a stable and reliable power grid while serving the increasing demand for electrical energy leaves researchers around the globe with difficult tasks. Topics like reduction of overall energy consumption and improvement of energy efficiency or construction of an intelligent energy distribution grid (smart grids) for better control of energy fluctuations [3, 4] are more important than ever. A different approach is the developing smart devices, which autonomously choose the best time to operate depending on energy availability and price [5]. Since the ways of producing energy have changed, consumers need to change their ways of consuming energy as well [6, 7]. But a change in consumer behavior requires them to have a basic understanding of both availability of and demand for energy.
Our idea is to develop a low-power wireless system for energy consumption analysis at mains sockets, which can be installed into every household or office. By providing traceability of power consumption for every load in a household, it is possible to give end consumers the opportunity to see, understand, and thereby optimize their own energy consumption behavior. As such, we developed a system to measure energy consumption directly at mains power sockets and transfer the data to a server were it can be viewed and analyzed by the end user. The systems back-end and infrastructure shall also serve as a platform for other smart home metering and home automation devices, presenting a variety of possible applications.
This article1 is built up as follows: After this introduction, we will give an overview over other research and related work done in the area of our research. We will then explain the platform architecture and its basic components for electric energy metering. The radio protocol for data transfer used by the metering devices will be presented, and the system’s usability is analyzed in terms of duty cycle, power consumption, and power supply. The last section lists the project’s results and open topics.
2 Related work
Virtually all households in the USA, as well as Europe, have electric meters installed [8]. While there are still conventional analog electric meters in use, electricity suppliers have started to equip households with modern digital “smart meters.” These “smart meters” replace traditional analog meters and offer the possibility of real-time usage data analysis by directly reporting the data to a utility from the provider. Unfortunately, these smart meters only provide usage data of a household’s overall power consumption and are dedicated to be used by metering service providers, not end users. This is disadvantageous because the provided data makes it difficult to identify per appliance power consumption or generate real-time feedback of energy usage for the end user. To achieve this traceability of energy usage, one field of research is to analyze high-fidelity power traces, measured by smart meters, and thus identify connected appliances and their current operating state [9–11] by their load signatures. Other research groups have worked in the field of wireless power metering. The basic concept is to provide a metering device in the form of a socket adapter or multi-contact plug, which connects to a wireless network to transfer the metering data to a data storage. “Plug” from MIT [12] thereby built a multi-contact plug with a current transformer and used analog-digital converters (ADC) for direct power metering of the connected load. Berkeley University’s ACme [8] is designed as a power plug adapter and with this equal to our solution. Like other similar devices, ACme has a high per adapter idle power consumption of 1 W, which is acceptable for measuring devices with high energy consumption like washing machines and PC work stations. For low-power-consuming devices, the high idle power of the metering adapters would waste lots of energy and thus reduce the potentially possible savings. We also have found several companies with smart home energy metering devices on the market [13–15]. Edimax “Smart Plug” uses Wi-Fi IEEE 802.11 standard network protocol for data communication, which is designed mainly as a versatile, high data rate radio protocol but not specialized for energy efficiency [14]. This explains the high power consumption of the metering devices and makes it less suitable for metering low-energy consumers. AVM “FRITZ!DECT 200” uses DECT ULE for data transmission [15]. Even if DECT ULE counts as low-energy radio standard, this device also requires an AVM FRITZ!Box IP router as base station. This limits the setup places and causes range issues (e.g., in basements). Voltcraft “Energy Count 3000” [13] uses 868-MHz radio for communicating and is more energy efficient than any other evaluated platform. As disadvantage, it provides no support for an IP gateway and thus can only be accessed via handheld remote panel with low range. Energy Count 3000 lacks usability of a web or mobile interface, which makes this platform more applicable for technical enthusiasts. All in all, we think that the analyzed related works lack energy efficiency and usability. We tried to conquer this by developing a specialized radio protocol and hardware to significantly reduce energy consumption of measuring devices and provide a versatile back-end to generate helpful front-end applications that help improve the energy efficiency of regular households.
3 System architecture
We evaluated and reverse engineered some of the commercially available smart home power metering devices [13–15] (see Section 2) and derived the following requirements for our platform: Building the measuring devices as adapters for mains power sockets with wireless communication is required to make the system easy to install without any technical requirements. This enables the user to meter energy consumption of any cable supplied device without further infrastructure requirements. Since our system shall utilize even small energy savings, it is required that the measuring device’s power consumption is low. Otherwise, the potentially high number of measuring devices will consume more energy than generate savings. Also, the system must be cheap, so that user investment can quickly repay itself [5]. Power consumption of the analyzed system’s metering devices varied in a range of 0.3–2.0 W per device, which seems to be relatively high. These values reflected our expectations about the energy efficiency of the respective system’s chosen radio communication technology. Therefore, our system uses an energy-optimized radio protocol to reduce energy consumption. Our system shall also be designed to be usable without any technical knowledge. This requires the measuring devices to autonomously build a communication grid and integrate all measuring devices, so that measured data can be transferred to a storage server without difficult setup procedures. For communication with a decentralized server, the system requires an IP gateway. Further, user data is a matter of privacy. All communicated and stored data must be secured using state-of-the-art encryption methods [16]. For the front-end, the data must be pre-evaluated and presented in a simple and understandable way. This is required to enable a wide-range use, even for users without higher knowledge of electric principals.
The so-designed system consists of several smart energy measuring devices, which use a low-power radio protocol to communicate with a gateway. This gateway routes the data to a different communication technology to transfer it to a database server. The users can access their data through a graphical user interface (GUI) front-end. Figure 1 illustrates the system architecture with GUI front-end and the metering platform back-end.

System architecture overview. Basic system architecture and system context overview
3.1 Smart energy measuring device
The smart energy measuring device (SEMD) is the root power measuring device. It handles consumption measurement and data communication. Therefore, a circuit board was designed, which supports an interface to connect 230-V devices to measure grid voltage and electricity consumption at maximum μC rate. The devices will calculate and buffer minimum, maximum, and average power consumption values and communicate them to the gateway. Communication is performed cyclically once every minute to reduce communication time and thereby energy consumption.
The chosen communication cycle value of “once per minute” reflects a good trade-off between energy efficiency, duty cycle utilization, and resolution of measuring data. As depicted in Fig. 2, reducing the communication cycle (e.g., once every 2 min) while still transmitting the average, minimum, and maximum values measured within the interval will reduce the metering resolution but reduce energy consumption (shown in Section 5.3) and duty cycle utilization (explained in Section 5.1) due to data communication. Increasing the communication cycle will increase the energy consumption of the measuring devices (see Section 5.3), and the increased duty cycle utilization will lead to an overall lower number of installable devices (see Section 5.1).

Transmission cycle dependencies. Energy consumption and duty cycle utilization depending on the transmission cycle
For communication, we used 868-MHz radio with a self-developed bi-directional low-power protocol which will be explained later. We used the Texas Instruments CC430 system on chip (SoC) [17] μC with integrated 868-MHz transceiver for low-power radio communication and AES-128 decryption and encryption support.
The power measuring module is the core of the SEMD. Therefore, voltage and current must be measured by an integrated circuit (IC). Through voltage divider and rectifier, it is possible to connect the power grid input directly to the ADC input of a micro controller [18]. This method is simple, and the required components are cheap while external dimensions of the circuit’s components are small, making it possible to build SEMDs in small-sized chassis. The major downside of this method is that the low-power circuit of the logic part is directly connected to the power input/output (230 V). We used galvanic isolated measuring hardware to overcome this problem. ACPL-C87X [19] and ASC711 [20] sensors safely divide the high- and low-power circuits using a barrier layer. The downside of this method is the high cost and power consumption of the measuring hardware. ASC711 current sensors are limited to a maximum load current of 12.5 A but have a higher accuracy and lower price than ICs of the same type with higher maximum current. The limit of 12.5-A current might reduce possible applications of the SEMD and may be changed in future iterations. For our prototype, a restriction on only measuring devices with less than 2875-W load (single phased) was considered acceptable.
The back-end devices were designed with possibility of bi-directional communication to gather measured data and control connected devices. This bi-directional communication enables transfer of commands from the user interface to the SEMDs. Possible control options like power switching, user-programmed time-triggered switching, or master-slave coupling can be implemented in further iterations of the devices.
Figure 3 depicts the hardware layout, separated in 12 logical sectors depending on the component functionality. The core element of the circuit board is the Texas Instruments CC430 μC. Voltage and current measuring is located at the upper left side of the board while the upper right side is designated for power supply and debugging. The board provides a 3.0-V power supply input connector for possible battery power supply at CON12 and a JTAG hardware debugger interface located at CON11 (disabled by jumper JP1). Since the SEMD is connected to the 230-V power grid, a power regulation block for 230-V AC power supply is located at the middle left, consisting of a voltage divider and rectifier to transform the supply voltage input down to 5.0 V. For the required 3.3-V supply voltage for the μC, an additional power regulation block is located underneath the 5.0-V power regulation block to transform the 5.0-V output further down to 3.3 V while the IC power stabilizer further stabilizes the IC supply voltage. The power coupling connector left of the power regulation blocks provides an interface for external 5.0-V power supply, bypassing the 5.0-V power regulation blocks. In case the circuits are powered by 230-V power supply, the input shall be connected to the high-power connector located underneath the power regulator blocks, which provides a circuit breaker for safety. At the bottom left side, the external port connectors CON1 and CON2 provide direct access to pins P1 and P2 of the CC430 μC, which can be used as digital I/O pins with interrupt capability. At low-power connector block, power measuring of the CC430 can be enabled/disabled by directly connecting the 5.0-V power supply input to the CC430 ADC ports. Block RF environment contains the antenna for the radio transceiver.

Conceptional hardware layout. Hardware layout overview with logical sectors
3.2 Gateway
The gateway is designed as master in the SEMD’s radio communication setup and must be placed within range of all SEMD clients. Master and client software are basically identical, and operation mode only differs by software configuration. This enables each client to work as a master in the communication setup if required and should enable SEMDs to function as master and client simultaneously, thereby enabling the setup of a multi-hop protocol for increased setup range of the metering devices [21]. In the current version, all measuring devices work with a simple single-hop protocol but an expansion to multi-hop is planed for future iterations. The gateway gathers an averaged data sample of all clients once per minute and transfers it to the server via a different communication technology. The communication cycle value of “once per minute” was chosen as a good trade-off between energy efficiency, duty cycle utilization, and resolution of measuring data as explained in Section 3.1. Used technology depends on availability, and a gateway can be built using Ethernet, WLAN, mobile radio, serial protocols, etc. For generic purposes, IP-based communication might be preferred. In the test setup (see Fig. 4), we used a serial RS232 connection. This decision was made since the micro controller of the SEMD configured as gateway already supports RS232 communication and no further hardware was required.

Measuring setup. Measuring setup with two SEMD clients, one SEMD master and server
3.3 Server
The server works as data storage and user interface back-end. It communicates with the SEMD master and stores all data transmitted by the SEMD. Communication between gateway and server can be established using different types of network technology, e.g., Ethernet. This makes it possible to set up one server for several users in a larger server center, reducing server allocation price and energy consumption per user. Servers store all data in a database to organize the possibly huge amount of metering data from different households [22] and provide a web interface to enable graphical analyses of the user’s data. For the test setup (see Fig. 4), we used a Raspberry Pi B+ that hosts a MySQL database and provides web server services for the developed web interface.
4 Protocol
Based on the chosen 868-MHz radio technology, we analyzed IEEE 802.15.4 protocols [23] for media access control. This led us to develop a low-power protocol, which is optimized for energy efficiency in our scenario and supports dynamically integration of new devices. The protocol is composed of a registration phase and a data phase, which are each handled within the communication cycle of 1 min. For simplicity reasons, the protocol was built as a single-hop protocol and uses fixed package length for each client communication. A future extension of the protocol for multi-hop scenario was taken into consideration in the design process.
4.1 Registration phase
Registration phase consists of five steps that will be handled every communication cycle by the master and all clients that are not yet connected. The registration phase works as follows:
-
1.
In this phase, the master node waits in receive mode for a client to send a beacon signal (see Fig. 5 a).
Fig. 5 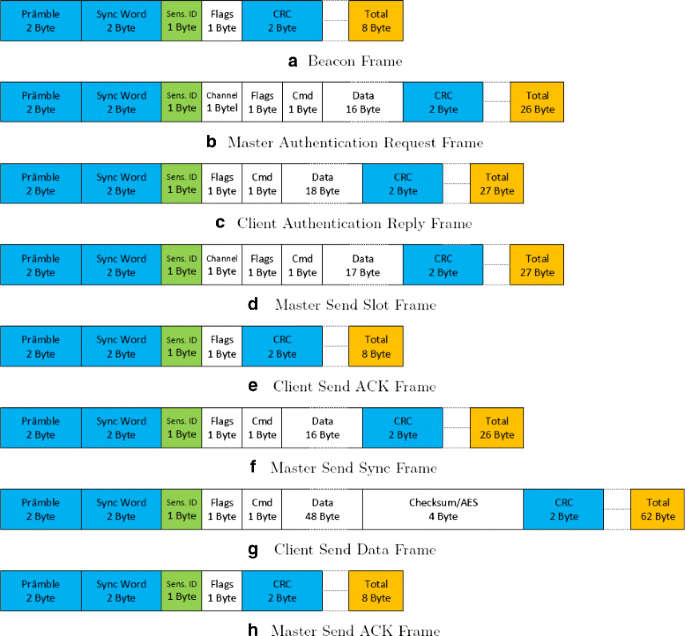
Protocol frames. Protocol frames as specified for the radio protocol
-
2.
On reception, the master node transmits its public key and requests the client node to switch channel and authenticate itself. This is done using a public key authentication method (see Fig. 5 b).
-
3.
The client sends its authentication password, encrypted with the master’s public key. Additionally, the client sends its own public key to set up a bi-directional encrypted communication (see Fig. 5 c).
-
4.
Once authentication was successful, all communication will be encrypted from this point forward. The client receives a personal slot in the master’s data receive frame as well as the system time to synchronize with the master (see Fig. 5 d).
-
5.
Finally, the client acknowledges the received data package and switches to data transfer mode. The registration is completed (see Fig. 5 e).

Each registration phase of a client requires a total data exchange of 96 bytes. This equals a total transmission period of 28.6 ms.
4.2 Data transmission phase
Data phase consists of master’s sync-beacon step and the actual transmission of the measure data from client to master. It therefore has three steps, whereby steps 2 and 3 will be repeated for each client. The data phase works as follows:
-
1.
The data phase starts with the master sending a sync beacon. This beacon is received by every client and is used to synchronize the system time to prevent drift. With the sync beacon, the master can send additional commands to specific client or as broadcast. This makes it possible to adjust or request client parameters like enabling or disabling the 230-V output (Fig. 5 f).
-
2.
Once the command window ends, the master switches to Rx mode and clients start transmitting there data in the assigned slots. The data frame can also contain the information requested by the masters. Additionally, each slot can be divided into sub slots to enable a multi-hop scenario for future extensions of the protocol (Fig. 5 g).
-
3.
The master acknowledges each data package if reception was successful. Steps 2 and 3 will be repeated until all registered clients have been handled (Fig. 5 h).
Each data package transmitted by a client contains the average power consumption as well as P min and P max of the connected load since the last transmission. Transmission has a size of 62 bytes and requires a send duration of 16.5 ms. The size of the sync-beacon frame depends on the number of transmitted commands. As a minimal size, this frame has 26 bytes and takes 6.9 ms to be transmitted. Since the size of the frame cannot be precalculated, this slot must be designed with a reasonable size. We assumed that 100 ms till the start of the first data transmission frame should be enough.
5 System usability
As a final result, we constructed three metering devices, which can be configured as both client and master. With this, it was possible to build the platform’s basic metering infrastructure and transfer the data to the server database (see Fig. 4). The metering part was further analyzed in terms of duty cycle utilization and power consumption. Additionally, the platform shall not be limited to power metering only. By exchanging the metering hardware of the data gathering system, it would be possible to use different sensors, like flow rate, humidity, or temperature sensors. These devices could use the communication infrastructure built by the SEMDs. Therefore, it is also important to analyze the system with respect to battery lifetime.
5.1 Duty cycle
The protocol shall satisfy the duty cycle restrictions of the used 868-MHz radio frequency band as prescribed by the regulator. The duty cycle prescribes a maximum utilization in send time (Tx) per hour. We aimed to achieve a duty cycle of <1 % and analyzed the send timings of client and master devices in this regard. Protocol communication utilizes three different channels, so the duty cycle must be fulfilled for each channel separately.
The client SEMD starts by registering to the master. This communication uses two channels. Channel 1 is used to request a slot in the communication network. Overall send time in this phase is 3 ms. Channel 2 is used for key exchange and assignment of the data transmission slot. Overall send time is 11 ms. For further analyses, the maximum number of client registrations per hour must be known. Client registration takes one communication cycle, and if the client’s data transmission failed three consecutive cycles, the client reconnects. The worst case is when a client reconnects every four communication cycles. With a communication cycle of 1 min, this sets a theoretical worst-case maximum of 15 client registrations per hour. Channel 3 is used for data transmission. The send time per communication cycle is 18 ms. Resulting timings are shown in Table 1.
The master SEMD sends a registration beacon on channel 1 and then answers to each registration request of a client, requesting the client to switch to channel 2 for authentication. Overall send time in this phase is 10 ms. Channel 2 is used for key exchange assignment of the data transmission slot. Overall send time in this phase is 30 ms. For further analyses, the maximum number of client registrations per hour must be known. As explained above, the theoretical worst case of client reconnects per hour is 15. Data transmission is performed on channel 3. The master sends a sync beacon as well as the control command frame with a maximum send time of 67 ms. Then, the master receives and acknowledges the client data packages. The maximum send time per communication cycle is 3 ms per client. Resulting timings are shown in Table 2.
The duty cycle utilization of channel 3 depends on the number of registered clients. Through reverse calculation, it is possible to get the maximum number of possible clients to fulfill the duty cycle of 1 % (36 s per hour). With the set 1-min communication cycle, the master spends 4020 ms per hour sending the sync beacon, leaving 31,980 ms to acknowledge client data transmission. Acknowledging the maximum of 60 successful data transmissions per hour of one client takes 180 ms. This defines the maximum number of connected clients to 177 (1). For more devices, the overall data transmission cycle must be reduced to less than once per minute.
5.2 Encryption
Transmitting usage data of private electrical devices, including a reference for determining the corresponding device itself via radio, has also been analyzed in terms of security. The data itself is a matter of privacy and shall not be readable from unauthorized persons. Additionally, the concept of controlling connected devices by enabling or disabling the power output of the SEMD provides a further target for attack on the system. For these reasons, all communication between the devices and the server must be secured with state-of-the-art encryption methods. There are two basic concepts of encryption, synchronous and asynchronous. Most notably is that synchronous encryption requires far shorter encryption keys for equal security than asynchronous methods. Further, state-of-the-art synchronous encryption algorithms are less complex compared to asynchronous encryption algorithms [24]. These facts are especially important on embedded devices with low processing power since encryption and decryption operations will increase CPU load and thus require energy. Another factor is the key exchange. For asynchronous encryption, public keys can be exchanged easily in our scenario. For an exchange of synchronous keys, further overhead in terms of security must be performed. Since the TI CC430 μC supports an AES accelerator module to perform AES128 encryption and decryption in hardware [17], AES128 cipher method was chosen for data encryption. The AES hardware acceleration module increases the performance on encryption and decryption and thereby does not increase CPU load while providing the advantages of a simple key exchange of asynchronous encryption methods.
5.3 Power consumption
All metering devices are required to have low power consumption and have therefore been evaluated mathematically, with consumption values from the data sheet shown in Table 3. Each master and client performs three cyclic operations: metering, SoC standby, and SoC communication with current drain shown in Table 3. For communication, each client spends 1080 ms per hour in Tx mode and 23,520 ms per hour in Rx mode for transmitting data. Additionally, in worst case, a client spends 210 ms per hour in Tx mode and 570 ms per hour in Rx mode reconnecting 15 times per hour (see Table 4). The theoretical worst case of 15 reconnects per hour is explained in the above section. For simplified calculations, the SEMD master does not perform any metering operations, so its power consumption reflects only the communication part. Communication timings depend on the number of connected clients. A base value for master communication power consumption was calculated for one connected client. This base value serves as estimation of its power consumption per client and can be used as upper estimation since this base value includes the communication’s basic overhead, which does not multiply per client. Resulting timings per hour for the master communication are 4200 ms Tx mode and 7800 ms Rx mode for data transmission as well as 600 ms Tx mode and 675 ms Rx mode for worst-case client registration (see Table 4).
For further calculation, SoC standby current drain was assumed as present during standby and communication. This assumption is wrong since the device can either be in standby or communication state but will reduce the complexity of current drain calculations. Since the communication duration is negligibly low in comparison to the standby duration, this only leads to a minor error in the current drain calculation, and real values will be lower. Table 5 shows the average current drain for the SEMD.
Result of the calculations (see Table 6) is an average power consumption of the client SEMDs of P C<16.833 mW. For master SEMDs, power consumption with one connected client is P M1<0.231 mW. This assumes that the master is used as gateway only and does not perform any measuring operations. Since the operation scenario has several clients connected to the master, this value can simply be multiplied by the number of clients connected. Figure 6 shows the energy consumption of SEMD master in dependency of the number of connected SEMD clients.

SEMD—master power consumption. SEMD—master power consumption depending on connected clients
5.4 Power supply
The main usage of the SEMD is to measure power data of 230-V devices. Therefore, the SEMD is connected to the 230-V power grid and can be supplied through an integrated transformer. It is also thinkable to use the SEMD communication infrastructure as back-end for different smart home metering platform application scenarios that utilize distributed non-electrical sensors. These sensors may not be connected to the power grid but could use battery supply. Battery lifetime depends on nominal voltage and capacity of the used battery. A supply voltage level of 3 V with a capacity of 2400 mAh can be achieved by using two serial connected Mignon (AA) batteries. Our calculations show that for the communication part, the battery’s self-discharge is higher than the SEMD’s communication power consumption (client 19.269 μW, master 10.394 μW). This means that the lifetime on battery supply mainly depends on the primary sensor. With enabled measuring, the SEMD’s battery lifetime is very low (client <18 days). This is due to the high power consumption of the current and voltage metering components. Power consumption of different sensors (e.g., temperature sensors) may be lower, resulting in longer battery lifetime.
6 Conclusions
The final result of our research was a fully operational prototype for energy consumption analysis at mains power sockets with low-power radio communication in the 868-MHz band. Still, there is plenty of work left. Theoretical analysis of the protocol shows very low energy consumption. In comparison to the state-of-the-art analysis in Section 2, it shows that the device can be significantly more energy efficient. With state-of-the-art devices requiring about 0.3–2 W per device, our prototype shows an improvement of factor 10. Still, further improvements in terms of energy efficiency and bandwidth can be made. All power consumption analyses have been made mathematically using values from the data sheets and must be backed with real measured values. The protocol is not yet fully implemented. For the prototype, we reduced the protocol to single-hop, but the protocol was designed to be multi-hop. With more measuring devices, extending the protocol to multi-hop would enable significantly increased setup range for the SEMDs. Bi-directional communication is supported by the protocol to send control commands to the measuring devices for remote control. In the current state of the work, these commands are not evaluated by the client. In terms of measurement, the current hardware seems to be too expensive and has high power consumption. To fulfill our goal of a low-priced, low-powered power measuring system, different measuring hardware solutions must be used. Measurement without galvanic separation as explained beforehand might be an alternative and must be evaluated. The developed system provides a base technology for our metering platform and enables numerous smart home metering applications. Currently, users can only view their data via a web interface. Developing advanced web-views/interfaces, smart phone applications, or other services built on top of this platform is possible but still an open topic. As an example, a service could automatically evaluate energy consumption of distinct devices and compare it with an internal table of energy consumption values or use the data for other users for comparison. By this, the service could recommend a replacement device with higher energy efficiency and deliver a calculation of return on investment, using the metered data of the old and new device. Additionally, all data could be anonymized and used in other researches and studies since the system provides high-resolution data of energy load in common households. Another topic is to developing web-views that present the metered data to the user, especially since the users might not have any background knowledge about electronic principals. The data presentation must enable the user to understand their energy consumption behavior and show ways to improve. This might require further research in terms of acceptance and usability by the user.
7 Endnote
1 This article is an extended version of a conference paper published at 12th International Workshop on Intelligent Solutions in Embedded Systems (WISES), 2015 [25].
References
H Farhangi, The path of the smart grid. IEEE Power Energy Mag.8:, 18–28 (2010).
CW Potter, A Archambault, K Westrick, in Power Systems Conference and Exposition, 2009. PSCE ’09. IEEE/PES. Building a smarter smart grid through better renewable energy information, (2009), pp. 1–5. doi:10.1109/PSCE.2009.4840110, http://ieeexplore.ieee.org/xpl/login.jsp?tp=\&arnumber=4840110\&url=http\%3A\%2F\%2Fieeexplore.ieee.org\%2Fxpls\%2Fabs_all.jsp\%3Farnumber\%3D4840110.
K Volbert, T Waas, P Schlegl, P Robatzek, M Kucera, in International Journal of Advancements in Electronics and Electrical Engineering, 4. Performance analysis of mobile radio for automatic control in smart grids (theIRED, 2014), pp. 69–75. http://seekdl.org/journal_page_papers.php?jourid=87\&issueid=136.
S Kenner, R Thaler, M Kucera, K Volbert, T Waas, in Intelligent Solutions in Embedded Systems (WISES), 2015 12th International Workshop On. Smart grid architecture for monitoring and analyzing, including modbus and rest performance comparison (IEEE, 2015), pp. 91–96. http://ieeexplore.ieee.org/xpl/articleDetails.jsp?reload=true\&arnumber=7356988.
M Jahn, M Jentsch, CR Prause, F Pramudianto, A Al-Akkad, R Reiners, in 2010 5th International Conference on Future Information Technology. The energy aware smart home, (2010), pp. 1–8. doi:10.1109/FUTURETECH.2010.5482712, http://ieeexplore.ieee.org/xpl/login.jsp?tp=\&arnumber=5482712\&url=http\%3A\%2F\%2Fieeexplore.ieee.org\%2Fxpls\%2Fabs_all.jsp\%3Farnumber\%3D5482712
O Siddiqui, P Hurtado, K Parmenter, in Electric Power Research Institute, 1016905. The green grid: energy savings and carbon emissions reductions enabled by a smart grid (Electric Power Research Institute, 2008). https://www.smartgrid.gov/document/green_grid_energy_savings_and_carbon_emissions_reductions_enabled_smart_grid.
J Dobson, J Griffin, in Proceedings of the 7th ACEEE Summer Study on Energy, 10. Conservation effect of immediate electricity cost. feedback on residential consumption behavior (ACEEE, 1992). http://aceee.org/files/proceedings/1992/data/index.htm.
X Jiang, S Dawson-Haggerty, P Dutta, D Culler, in Information Processing in Sensor Networks, 2009. IPSN 2009. International Conference on. Design and implementation of a high-fidelity AC metering network, (2009), pp. 253–264. http://ieeexplore.ieee.org/xpl/login.jsp?tp=\&arnumber=5211926\&url=http\%3A\%2F\%2Fieeexplore.ieee.org\%2Fxpls\%2Fabs_all.jsp\%3Farnumber\%3D5211926.
M Ito, R Uda, S Ichimura, K Tago, T Hoshi, Y Matsushita, in Applications and the Internet, 2004. Proceedings. 2004 International Symposium on. A method of appliance detection based on features of power waveform, (2004), pp. 291–294. doi:10.1109/SAINT.2004.1266131, http://ieeexplore.ieee.org/xpl/login.jsp?tp=\&arnumber=1266131\&url=http\%3A\%2F\%2Fieeexplore.ieee.org\%2Fiel5\%2F8941\%2F28312\%2F01266131.
C Laughman, Lee K, R Cox, S Shaw, S Leeb, L Norford, P Armstrong, Power signature analysis. IEEE Power Energy Mag.1:, 56–63 (2003).
WK Lee, GSK Fung, HY Lam, FHY Chan, M Lucente, in International Conference on Electrical Engineering (ICEE). Exploration on load signatures, (2004). http://citeseerx.ist.psu.edu/viewdoc/summary?doi=10.1.1.120.5328.
J Lifton, M Feldmeier, Y Ono, C Lewis, JA Paradiso, in 2007 6th International Symposium on Information Processing in Sensor Networks. A platform for ubiquitous sensor deployment in occupational and domestic environments, (2007), pp. 119–127. doi:10.1109/IPSN.2007.4379671, http://ieeexplore.ieee.org/xpl/login.jsp?tp=\&arnumber=4379671\&url=http\%3A\%2F\%2Fieeexplore.ieee.org\%2Fxpls\%2Fabs_all.jsp\%3Farnumber\%3D4379671
Voltcraft Energycount 3000 Logger. http://www.produktinfo.conrad.com/datenblaetter/125000-149999/125353-an-01-ml-TCRAFT_ENERGYC_3000_ENER_MESSG_de_en_nl.pdf Accessed May 2014.
Smart plug switch with power meter: intelligent home energy management. http://www.edimax.com/edimax/mw/cufiles/files/download/datasheet/SP-2101W_Datasheet_English_EU_type.pdf. Accessed May 2015.
FRITZ!DECT 200. http://en.avm.de/products/fritzdect/fritzdect-200/technical-data/. Accessed May 2015.
P McDaniel, S McLaughlin, Security and privacy challenges in the smart grid. IEEE Secur Priv Mag. 7:, 75–77 (2009).
MSP, 430™ SoC With RF Core. http://www.ti.com/lit/ds/symlink/cc430f6137.pdf. Accessed May 2015.
R Prasad, Fundamentals of Electrical Engineering (Prentice Hall, India, 2005).
ACPL-C87B, ACPL-C87A, ACPL-C870: precision optically isolated voltage sensor. http://www.avagotech.com/docs/AV02-3563EN. Accessed May 2015.
Hall effect linear current sensor. http://www.allegromicro.com/en/Products/Current-Sensor-ICs/Zero-To-Fifty-Amp-Integrated-Conductor-Sensor-ICs. ACS711.aspx. Accessed May 2015.
A Woo, T Tong, D Culler, in Proceedings of the 1st International Conference on Embedded Networked Sensor Systems. Taming the underlying challenges of reliable multihop routing in sensor networks (ACMNew York, NY, USA, 2003), pp. 14–27. http://doi.acm.org/10.1145/958491.958494, http://dl.acm.org/citation.cfm?id=958494\&dl=ACM\&coll=DL\&CFID=644887221\&CFTOKEN=42668733.
WJ Buchanan, in The Complete Handbook of the Internet. Databases and data storage (SpringerBoston and MA, 2002), pp. 1333–1350.
JA Gutierrez, EH Callaway, R Barrett, IEEE 802.15.4 Low-Rate Wireless Personal Area Networks: Enabling Wireless Sensor Networks (IEEE Standards Office, New York, NY, USA, 2003).
A. Nadeem, MY Javed, in 2005 International Conference on Information and Communication Technologies. A performance comparison of data encryption algorithms, (2005), pp. 84–89. doi:10.1109/ICICT.2005.1598556.
M Altmann, P Schlegl, K Volbert, in Intelligent Solutions in Embedded Systems (WISES), 2015 12th International Workshop On. A low-power wireless system for energy consumption analysis at mains sockets (IEEE, 2015), pp. 79–84. http://ieeexplore.ieee.org/xpl/articleDetails.jsp?reload=true\&arnumber=7356986.
Acknowledgements
This work was supported by the research cluster for Robotics, Algorithms, Communication and Smart Grid (RAKS) of the OTH Regensburg. Further information is under http://www.raks-oth.de.
This work was also supported by the Regensburg Center of Energy and Resources (RCER) and the Technology and Science Network Oberpfalz (TWO). Further information is under www.rcer.de.
Competing interests
The authors declare that they have no competing interests.
Author information
Authors and Affiliations
Corresponding author
Rights and permissions
Open Access This article is distributed under the terms of the Creative Commons Attribution 4.0 International License (http://creativecommons.org/licenses/by/4.0/), which permits unrestricted use, distribution, and reproduction in any medium, provided you give appropriate credit to the original author(s) and the source, provide a link to the Creative Commons license, and indicate if changes were made.
About this article

Cite this article
Altmann, M., Schlegl, P. & Volbert, K. A low-power wireless system for energy consumption analysis at mains sockets. J Embedded Systems 2017, 8 (2017). https://doi.org/10.1186/s13639-016-0041-y
Received:
Accepted:
Published:
DOI: https://doi.org/10.1186/s13639-016-0041-y