- Research
- Open access
- Published:
Sensing user context and habits for run-time energy optimization
EURASIP Journal on Embedded Systems volume 2017, Article number: 4 (2017)
Abstract
Optimizing energy consumption in modern mobile handheld devices plays a very important role as lowering energy consumption impacts battery life and system reliability. With next-generation smartphones and tablets, the number of sensors and communication tools will increase and more and more communication interfaces and protocols such as Wi-Fi, Bluetooth, GPRS, UMTS, and LTE will be incorporated. Consequently, the fraction of energy consumed by these components will be larger. Nevertheless, the use of the large amount of data from the different sensors can be beneficial to detect the changing user context, to understand habits, and to detect running application needs. All these information, when used properly, may lead to an efficient energy consumption control.
This paper proposes a tool to analyze user/application interaction to understand how the different hardware components are used at run-time and optimize them. The idea here is to use machine learning methods to identify and classify user behaviors and habit information. Using this tool, a software has been developed to control at run-time system component activities that have high impacts on the energy consumption. The tool allows also to predict future applications usages. By this way, screen brightness, CPU frequency, Wi-Fi connectivity, and playback sound level can be optimized while meeting the applications and the user requirements. Our experimental results show that the proposed solution can lower the energy consumption by up to 30 % versus the out-of-the-box power governor, while maintaining a negligible system overhead.
1 Introduction
Mobile and communicating devices became essential tools in our personal and professional activities. In recent years, their number and their applications have largely increased. In our modern societies, each person has several handheld devices (smartphone, tablet, portable PC, etc.). By the end of 2013, 6 % of the global population owned a tablet, 20 % owned portable PCs, and 22 % owned smartphones.1 It is predicted that by 2017, 65 % of the US population will own a smartphone.
Next-generation mobile systems will include a large number of cores, a powerful GPU, large caches, memory capacity, and a variety of I/O tools and communication protocols. For instance, the Samsung Galaxy S6 launched in 2015 contains three times more sensors than the Samsung Galaxy S marketed in 2010. In the same time, the number of cores has also increased from 1 to 8.2
Consequently, on one side, next mobile system generations will contain more powerful components and on the other side, applications running on these devices will become more complex. As a result, the needs of new applications in terms of computing power, communication, and storage have significantly exceeded the capacity of the batteries. For this reason, new energy consumption management systems are needed.
Most of the existing technics for energy saving take into account neither the user individual profiles nor the changing application needs. Our proposal is to capture, store, and process such information using the computing power and the various sensors to reduce energy consumption. The key for our power saving technique is therefore to leverage users context, behaviors, and habits to predict the running applications and improve upon the default energy management policies of the OS. The main contributions of this work can be summarized as follows.
-
1.
We exploit rich sensor hubs to collect and explore a large set of data to search context usage patterns in the device use. We also use metrics to gauge user needs and characterize his/her habits. The identification of the context and the user’s associated actions allow us to decrease the energy dedicated to unused resources in some cases.
-
2.
We propose a new classification and characterization method of the launched applications to find frequent sequences of application runs. On this basis, we can predict which application will probably run next. With the developed prediction and the knowledge of each application needs, we are able to adjust the provided resources and to perform optimizations such as dynamic voltage frequency scaling (DVFS) [1], data prefetching, and device management without impacting negatively the user satisfaction. Such actions decrease the energy consumption of the whole system.
The global architecture of our approach is shown in Fig. 1. This figure presents an abstraction of the several key stages of our approach. The first stage consists in collecting data about the user behavior and the device’s context, such as running applications, the background processes, the device’s position, the ambient luminosity, the datem and the time. These data are used in the second stage through three mechanisms:
-
Off-line classification of applications in terms of resources
Fig. 1 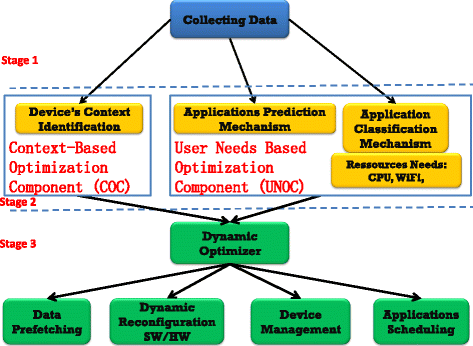
Overview of the proposed approach. A generalization of the several stages of the proposed approach
-
Application prediction mechanism
-
On-line device’s context identification

In the third stage, the dynamic optimizer actuator uses the outputs of the second stage to perform actions such as device management and applications scheduling in order to reduce the energy consumption. We have a global framework which contains two main components:
-
Context-based optimization component (COC): based on the device context and the sensory data
-
User needs-based optimization component (UNOC): based on user actions and application classification.
The rest of this paper is organized as follows. In Section 2, the architecture of the framework containing the COC and UNOC is presented. In Section 3, we explain the COC. In Section 4, we present in details the UNOC with the classification and prediction mechanisms. In Section 5, we present the experimental results. Section 6 presents the related work, and finally, in Section 7, a conclusion and some perspectives are given.
2 Framework architecture for energy consumption optimization
In order to obtain the provided objectives in the previous section, we designed a framework to optimize the energy consumption in mobile systems and to improve the energy management provided by the OS. This framework consists of two components, the COC and the UNOC. They use different sensors/data and run in parallel. However, depending on the type of used device (smartphone, tablet, ultrabook, etc.) some functionalities in COC or UNOC can be more suitable. The proposed screen brightness management that depends on the device position is more appropriate to laptops or fixed ultrabook. All the rest of optimizations, screen brightness management using the ambient luminosity, the microphone level management based on the ambient noise, and the user needs/habits-based component, can be exploited in all mobile platforms with an OS and a user layer. Consequently, smartphones, laptops, and tablets can benefit of these mechanisms. The functional architecture of the proposed components are given in Fig. 2 for COC and in Fig. 3 for UNOC. These components implement the abstract architecture presented in Fig. 1.

Context-based optimization component architecture. Architecture of the first component of our framework based on the context

User needs-based optimization component architecture. Architecture of the second component of our framework based on the user needs and habits
2.1 Context-based optimization component (COC)
COC is responsible of collecting data from the embedded sensors, device position, ambient luminosity, and ambient noise, etc. These data compose the device context taken into account to apply different policies on the screen brightness and the speaker sound level as shown in Fig. 2. COC works in two phases:
-
1.
Device context analysis: in this phase, we realize some preliminary experiments to analyze and to determine the device context. Among the available sensors, we select the most relevant sensors which provide information about the device position and the ambient noise. The results are used to develop the second phase.
-
2.
Embedded software: in this phase, we control during run-time the system component’s activities. Depending on the context, these components may have a high impact on the consumed energy. The control is done by exploiting information obtained from the embedded sensors.
The main idea is that in embedded and mobile systems, it is possible to save energy and reduce power consumption by taking the context information into account. It could be attained by monitoring sensors that exist in mobile devices. Sensors’ data are processed and correlated to possible power consumption reduction opportunities.
2.2 User needs-based optimization component (UNOC)
This component is developed to take into account the user needs and habits in the energy consumption optimization. Its structure is generic and is shown in Fig. 3. UNOC is implemented in five steps as follows:
-
1.
Data collecting mechanism: user behavior and system usage information are collected.
-
2.
Processing the collected data through the analyzer to guarantee user privacy by anonymizing the data.
-
3.
Storing the collected data in a data base.
-
4.
This step is implemented in two phases:
-
(a)
Uploading the collected data to the back-end component in order to be processed via mechanisms like application classification, applications prediction, and user behavior profiling.
-
(b)
Building optimization rules.
-
(a)
-
5.
Pushing the obtained rules to the optimizer actuator in order to implement a specific optimization for each hardware component.
In this paper, we focus mainly on the data collecting mechanism, the application classification, the application prediction, and the optimization mechanism as follows.
-
1.
The data collecting mechanism: it represents the first step mentioned previously. In this phase, we collect a large set of data which are as follows: running applications, date, time, elapsed time of each application, and background process.
-
2.
This phase is composed of:
-
The off-line application classification in terms of Wi-Fi and CPU needs. In the current version of the UNOC, we focus on two components: the Wi-Fi and CPU. These two units are among the most power consuming components in mobile system but the classification can be extended to screen brightness, microphone, GPS, etc.
-
The execution average time for each application is calculated, and this phase is also off-line but the data base can be updated in a weekly basis.
-
In-line application prediction mechanism.
-
-
3.
All these phases are combined and used by the optimizer actuator which manages Wi-Fi connection and CPU frequency in order to optimize the energy consumption. The next section presents the COC in details.
3 Context-based Optimization Component (COC)
A crucial aspect of energy management is having a good understanding of how, when, and where users interact with their handset and how they demand resources such as luminosity, sound level, high consumption, connectivity, etc. COC relies on the device context and user actions, which are context driven by nature. The device’s context is defined by its position, the ambient light and the ambient noise. The screen brightness and the speaker sound level (respectively) are controlled by the device’s position (normal or abnormal, ambient luminosity and the ambient noise (respectively)). To do so, policies are applies to sensory data to impact power consumption. The Sensors Collection Module (SCM) and Dynamic Hardware Reconfiguration Module (DHRM) were developed to achieve the COC work. The following two sections explain how the SCM and DHRM are used for brightness and sound managements.
3.1 Brightness management depending on device’s position
3.1.1 Sensors Collection Module (SCM)
This module is responsible for collecting data from the embedded sensors in order to identify the most appropriate device’s stand. In our mobile handset, there are several sensors such as accelerometer, ambient light sensor (ALS), simple orientation sensor, inclinometer, compass, gyrometer, and geolocation. In order to determine which collected sensors are the most relevant, some preliminary experiments have been achieved. First, we collect the sensor values in several device’s position (normal standing, inclined, jostled, etc.). We compare sensors’ readings for various device positions in order to pick the most relevant. The sensor values which have a large gap in different positions are ignored. The available sensors are:
-
Ambient luminosity: ambient light sensor (ALS).
-
Orientation: inclinometer, compass.
-
Motion: gyroscope, accelerometer.
-
Location: GPS
-
Ambient noise: microphone
We select the following sensors:
-
1.
For ambient luminosity and ambient noise: we use ALS and microphone because these are the only sensors that provide us these information.
-
2.
For the orientation, we have chosen inclinometer because the obtained data from this sensor are more informative and compass data are changing due to magnetic strength.
-
3.
For motion, both of accelerometer and gyroscope have three-dimensional metrics on axes x, y, and z. In the following example, we compare standard deviations:
-
Accelerometer (x,y,z)=(0.57,0.37,0.52)
-
Gyroscope (x,y,z)=(89.42,57.80,54.95)
Normalized variation indicates sensitivity. More sensitive values are more informative. This comparison prompted us to choose gyroscope for motion.
-
-
4.
We exclude location-based data collection because it is private information (PI).
The SCM is calibrated by sensory data collected while the device is in standing position. After calibration, sensors data is collected in real time. This way, if the device is tilted, its inclination data is immediately updated in the SCM. Finally, data are injected in the memory in order to be consumed by the Dynamic Hardware Reconfiguration Module (DHRM). This reconfiguration is continuous and carried out in the background. Whenever a sensor value changes, SCM takes it into account. It updates the new value and upgrades it through a shared memory, then DHRM performs optimizations on the screen brightness level. Figure 4 presents the HW and logic sensors, and Fig. 5 presents the SCM process.

Available sensors on our mobile device. This figure shows the available HW and logic sensors

Sensors information collecting. This figure illustrates the sensors values collecting by SCM
3.1.2 Dynamic hardware reconfiguration module (DHRM)
This module is responsible to manage the hardware components depending on the device’s position as mentioned in Section 3.1.1. Available data in the shared volatile memory is imported and taken into account by this module in order to apply business logic decision mechanisms with the values. The module handles the LCD driver of the device to manage screen brightness as shown in Fig. 6.

Brightness management By DHRM. This figure illustrates the actions performed by DHRM (adjusting brightness)
The DHRM compares the new captured sensor’s values with the normal stand values. Then, according to this comparison, the DHRM adjusts the screen brightness to the most suitable level for the user. For example, if the gyroscope sensor value exceeds the range of allowed values, the module applies a specific optimization on the screen’s brightness by decreasing it. The ambient luminosity is also taken into account to adjust luminosity. When the environment is too bright, the screen brightness is increased and vice versa. For brightness management, the power reduction opportunity is about 30 % between the max screen brightness and the min screen brightness.
The DHRM relies on the data captured by the SCM and selects four stand device’s state. Here is an example for each state:
-
Hard-to-watch: device shake is too important to watch it correctly.
-
Mild-motion: from small movement to mild ones like when playing game.
-
Normal-stand: device left in the same position for a moment.
-
Abnormal-tilted: set device in ±90° on x-/y-axis with no motion.
Each state is recognized through sensors metrics. DHRM sets the corresponding screen brightness, according to the identified state, as shown in Table 1.
When the device is in normal stand, we take into account the ambient luminosity for brightness adjustment as shown in Fig. 7.

Screen brightness adjustment depending on ambient luminosity. Several ambient luminosity values (lux) and the corresponding screen brightness level
3.2 Sound management based on ambient noise
Another use case similar to Section 3.1 was achieved in order to manage the device’s speaker level depending on the ambient noise. As in the case of brightness management, we have two main modules. The first one is the Ambient Noise Collector (ANC) and is measuring the ambient noise and shares its to the second module Sound Control Module (SCM) which will adapt the speaker level accordingly.
For example, in this scenario when the ambient noise is high, the SCM increases the speaker’s sound level. On the other hand, if the ambient noise is at average or low, the module decreases the speaker’s sound level.
Contrary to the first component, we do not store the values of the ambient noise, and we act dynamically on the speaker’s volume. The sound level is modified gradually to avoid any impact on the user satisfaction, on the base of the change blindness [2].
4 User needs-based optimization component (UNOC)
4.1 Classification mechanism
In this paper, the classification is achieved off-line and used during the optimization phase as mentioned above. Applications are classified according to their Wi-Fi and CPU usage. For the Wi-Fi, the classification is binary (Wi-Fi on/off). For the CPU, the classification is based on upper frequency thresholds. In both cases and before adjusting any resources, the optimizer actuator consults the list of background processes to avoid any conflict.
4.1.1 Classification in terms of Wi-Fi
The aim of this classification is to contribute to the management of the wireless interface according to the needs of the running applications. To achieve the off-line classification, we realized some preliminary experiments. At first, the internet rate is estimated by the sum of the upload and download rate, when no application and background process are running. A low rate threshold was fixed at 10 KB because of the connectivity management in Microsoft Windows operating system that achieves some connection rate tests, even when no application needs connection. Secondly, we run the applications we want to classify individually and acquire bandwidth use. When the sum of the upload and download rates during the execution of the application is under the 10-KB threshold, we assume that no wireless connection is required (and vice versa). Table 2 shows the classification results for three examples of applications.
On this base, the on-line optimization is carried out: the Wi-Fi need is evaluated according to the running applications classes. Obviously, the main point is to assess the complete requirement of the mobile device current state in order to avoid the user dissatisfaction when the wireless connection is disabled.
4.1.2 Classification in terms of CPU need
Windows 8.1 manages the CPU frequency automatically. However, in some cases, the computing resources provided by the OS exceed what is required by the running applications and the user. To improve this management, we propose to classify the applications in terms of CPU frequency.
In the current implementation, we have arbitrarily defined three thresholds (800 MHz, 1.25 GHz, and 1.75 GHz) that define four classes:
-
1.
Class c 1: applications requiring a low CPU frequency (<800 MHz). Text processing applications such as Word, Excel, or simple games such as Imperial Sudoku belong to this class.
-
2.
Class c 2: applications requiring a medium CPU frequency (between 800 MHz and 1.25 GHz). Web browsers such as Firefox or Google Chrome are in this class.
-
3.
Class c 3: applications requiring high computing resources (between 1.25 and 1.75 GHz). Advances games such as 2048 belong to this class.
-
4.
Class c 4: applications requiring very high computing resources (over 1.75 GHz). Image processing and synthesis such as Image ray-tracing, simulation applications, and mathematical applications belong to this class. During our experiments, we found no applications belonging to this class.
To classify an application, the CPU utilization and frequency are measured during its execution. More precisely, the average (m), the standard deviation (e), and the ratio of the used CPU frequency relatively to the maximal frequency (f) are chosen to characterize each application. Then, the probability for an application to belong to the class c i given, m, e, and f are calculated. Our classification is achieved with the help of a naive Bayesian classifier. Although many other classification methods are available, decision trees (DT), rule-based methods such as logistic regression (LogR), linear regression (LR), Naive Bayes (NB), support vector machine (SVM), k-Nearest Neighbor (k-NN), and artificial neural networks (ANN). We chose a Naive Bayesian classifier because of its advantages and our type of data as:
-
Easy to implement
-
Fast to train (single scan). Fast to classify.
-
Requires a small amount of training data to estimate the parameters like in our case.
-
Not sensitive to irrelevant features which yields good results even when the NB assumption does not hold.
-
Converges quicker than discriminative model like logistic regression which implies less energy consumption for the training.
Our classifier operates as follow:
With the probability for an application to be classified in class i given m, e, and f
where
and
compute the different simple probabilities, we consider the distributions m, e, and f as Gaussian, e.g., with μ the average and σ 2 the ratio variance,
Table 3 shows the classification results for three examples of applications. According to the application class, the optimizer actuator selects the most suitable upper threshold among the three defined frequencies. Obviously, the optimizer actuator does not disable the resources that are required by running background applications, like Wi-Fi for the application Skype for instance.
After the static classification, we present in the next section the data collecting and prediction mechanism.
4.2 Data collecting and prediction
The parameters related to the different users, like job, lifestyle, age, and gender, vary from one person to another. This difference must be taken into account to propose an appropriate and customized mobile energy management for each user. In fact, application sequences, also called scenarios, are recurrent and correspond to distinct user situations. The idea is to analyze the various applications launched by the user according to the day of the week, the time, and the background processes.
4.2.1 User probe for data collecting and time processing
User probe is linked to different applications launched by the user during a long period of time. As mentioned previously, the main parameters are date and time. We assume that the user has different behaviors between weekdays and weekends and also between distinct periods of a given day.
For example, the applications launched during Monday morning at work are different from the applications running during a Saturday night. The behaviors are also supposed to differ from one user to another, e.g., according to their jobs as one can work in an accounting office while the other one works outdoors.
The user probe is executed at run-time. It collects each foreground window launched by the user and recovers the name of the related application, applications running in background, the day of week, the date, and time. Figure 8 resumes the user probe functionalities. Whenever the user launches a new application, the time spent on the previous one is calculated and registered in a database in order to calculate the average running time length for each application still considering a given day of the week and a given period of launching time.

User probe. User information collecting
4.2.2 Prediction of future running applications
As mentioned above, the principal idea is to propose a customized energy management of mobile systems which improves upon the standard energy management proposed by the operating system. This component depends on the user habits and the running applications over time. The purpose is to predict the future running applications for a given system resources consumption adjustment and thus to reduce the energy consumption in specific scenarios.
In order to predict future running application, we make the hypothesis that they may depend on the current running applications and temporal data. We have to find out whether the user has the habit to launch specific applications and in which order. The sequential pattern mining (SPM) techniques are dedicated to discover possible frequent sequences of items among time-related data. Among the numerous SPM techniques (see the survey proposed in [3]), we choose one of the simplest and most well-known, the Generalized Sequential Pattern (GSP) [4, 5].
The GSP algorithm is used to find frequent sequences of items, eventually revealing time-related correlations or causal structures among sets of data. Our motivation for using the GSP algorithm is to find regularities in the applications launched according to the day of the week, the time, and the background processes. More precisely, the items processed by the algorithm are the running applications in the same period of a given day during several weeks. For example, we would like to know if the same applications are frequently launched in the same order every Monday between 8 am and 10 am. The GSP algorithm can detect such frequent application sequences.
A sequence is frequent when its occurrence in the database is over a specified threshold. Based on the Apriori algorithm [6], GSP starts by collecting the applications whose frequency is higher than a minimal support threshold, to create the length-1 frequent sequence set. Then, it iteratively scans the data to collect the support count in order to select the length-(k+1) frequent sequences from the length-k frequent sequences. The process is repeated until no frequent sequence or no candidate sequence can be found. At the end of the GSP processing, we have the number of applications occurrence from 1 application sequence to k application sequence.
Table 4 shows a small example of data provided as input to the GSP process. These data show the running application sequences during four successive Mondays. The output is the number of applications occurrence from 9 am to 11 am as shown in the Fig. 9. “K” represents the sequence length, i.e., the number of items in the sequence. “R” is the repetition frequency, i.e., the number of times this sequence occurs.

GSP output example. GSP rules for the applications sequence
With K=1, the occurrence number R gives the number of times each single application appears; we note that Mozilla and VLC are the most frequent applications. With K=2, the occurrence number R concerns sequences composed of two applications, e.g., the sequence (2048, VLC) that appears three times. With K=3, the occurrence number R concerns sequences composed of three applications; we note that the sequence (Spotify, 2048, VLC) appears two times and several other sequences which appear one time. On the basis of the GSP outputs and with the data about the foreground application, date and time dynamically collected by the user probe, the applications that will be launched the next Monday can be predicted.
Distinct predictions can be made according to the sequence length, i.e., according to the “K” factor as follows.
-
With the length equal to 1 (K=1), the most probable application is predicted, whatever the current running application.
-
Whereas K=2 can predict the application that will follow the current one, like the game 2048 that appears after VLC.
-
K=3 can be used either to predict which application will be launched after the sequence formed by both the current and previous application launches or to predict which will be the two applications that are likely to be launched after the current one.
In this first work, we only studied the latter case (prediction based only on the current application), in which choosing the lowest K is more accurate to predict the next application that will be launched.
However, this increases the frequency at which the GSP rules are consulted, causing energy and time consumption. Even if the gain in terms of energy is considerable and the overhead is negligeable, a balance must be found. Figure 10 illustrates the prediction mechanism thru GSP processing.

Prediction example. Synthesis of the prediction mechanism
In order to determine the most appropriate K factor, we conducted measures to study the energy overhead generated by different values for K. Let’s take the example of the sequence [Mozilla, 20 mn-Word, 17 mn-VLC, 47 mn-2048, 7 mn]. With Mozilla as the current running application, the GSP rules predict the launching of Word, Word-VLC, or Word-VLC-2048 depending on the chosen K. The cost of the GSP rules consultation in terms of energy is by 2 W/S.
-
By choosing K=2, the energy overhead is about 6 W/S.
-
Whereas if K=4, the energy overhead is about 2 W/S.
The difference is negligible, and it is about 4 W/S of overhead for 71 minutes. The difference prompted us to choose K=2 for more precision and a negligible overhead.
The accuracy of application prediction increases with the amount of collected data. Therefore, the precision will increase in time. The second parameter that will impact the prediction is user behavior regularities. Indeed, when a user runs the same applications in the same context, the accuracy will be higher and vice versa. The prediction accuracy improvement is under development.
The next step is to adapt the energy management depending on the prediction phase, the elapsed time of the application run, and a classification in terms of resources.
4.2.3 Optimizer actuator
The optimizer actuator begins adjusting resources gradually for the application B before the end of the application A in order to not impact the user experience.
Indeed, a sudden change in terms of resource may impact heavily the satisfaction of the user, who would react by increasing resources manually, luminosity, etc., after the automatic adjustment done by the optimizer actuator. In this paper, for the Wi-Fi management, we use only the classification phase. Figure 11 shows the utility of the prediction.

Resources adjustment. This figure illustrates the utility of the prediction phase
User satisfaction is taken into account by the optimizer actuator, Section 4.2.3. For CPU performances, when frequency is scaled, the optimizer actuator verifies the acceptance of the proposed frequency by the user. If a new frequency is set by the user, this new value is stored and will be taken into account for the next run in the same context and for the same application as shown in Fig. 12.

User satisfaction parameter in resources adjustment. This figure shows how the optimizer actuator takes into account the user satisfaction as parameter in the optimization stage
5 Experimental results
This section is divided into two parts, the first one presents the tools and the experimental environment and the second one presents the results. The experimentations have been realized on an ultrabook with a 2.50-Ghz Intel dual-core i7-3667U processor and 4 GB of RAM. The proposed power manager is generic. The solution could run on any platform, such as tablets, smartphones, and ultrabooks. The main reason why the ultrabook has been chosen is to demonstrate the feasibility of our approach and the simplicity to connect it to our measurement device: the Yokogawa WT210 [7].
This mobile device also contains a port for Sim Card as well as a touch screen. It runs under Windows 8.1, and with the windows store, we have access to many applications as metro style application as Facebook, Viber, Shazam, and so on. These features are common with both smartphones and tablets which make its architecture similar to other mobile devices.
5.1 Tools and experimental environment
This section presents the experimental environment, the tools, and their usage. Figure 13 depicts this setup architecture. As our work is developed in partnership with the Intel Corporation, the Intel Energy Checker SDKit (iESDK) [8] has been used to implement our solution. The SDK has been designed to measure and optimize application energy efficiency. Two components of the SDK are leveraged in this work: the main driver (ESRV—energy server) and the modeler. The modeler provides the services required to implement data collection and energy saving heuristics. Several data collection extension modules, a.k.a. inputs libraries (ILs), as well as actuators libraries (ALs) have been developed. The modeler is composed of three components: the front-end, the input bus (IB) and the back-end.
-
The front-end (FE) collects the data: CPU utilization, display brightness, battery level, front-end applications, etc. Each metric is called an input. Collecting new metric requires the development of an (IL).
Fig. 13 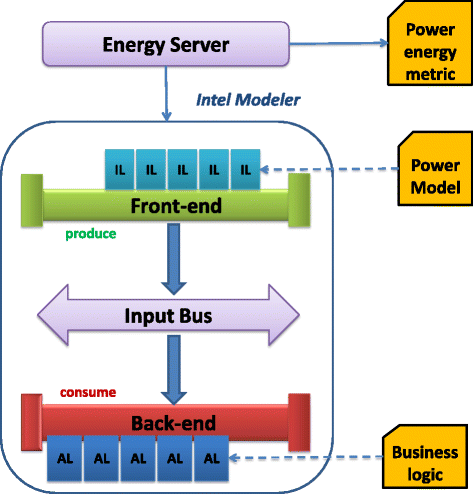
ESRV—Intel modeler framework. Intel tools components
-
Once collected by the ILs, metrics are made visible on the IB. Any agent connected to the bus has direct access to the metrics. The IB is the main interface between the FE and the back-end.
-
The back-end (BE) provides core services, e.g., a logger or a power-to-inputs automatic correlation, a watchdog, and communication manager. The BE can be expanded via ALs. ALs are designed to perform specific actions such as dynamic OS or platform configurations. Usually, ALs are used to implement various optimization heuristics that are driven in real time by the inputs provided by the FE.

In this paper, the SCM and the user probe were implemented as ILs. The DHRM, GSP, and the optimizer actuator were developed as ALs. In our experiments, we measure the power consumption of the whole system, we do not take into account a specific hardware component.
5.2 Context-based optimization component evaluation (COC)
The goal of this part of our experiments is to measure the power consumption of the ultrabook when our solution is deployed. We focus on the brightness parameter, and Fig. 14 shows the results. In Fig. 14, we have five phases in our graph, the first phase in blue represents the e-idle which indicates the power consumption before the deployment of our solution, the consumed power is estimated at 14 W. In the second, we note a power overhead which is due to the deployment of our solution, this overhead is about 5 W. The orange part represents the power consumption when the ultrabook is in a suitable position for the user, i.e., the screen brightness is increased. In the green part, we notice a power consumption decreasing which is due to the non-utilization of the ultrabook; thus, the brightness level is decreased and the amount of consumed power is about 10 W. This decrease in brightness translates into a power savings of 30 %. Finally, in the last blue part, the brightness level is reset because the device is back in normal position.

Power consumption evolution with context-based optimization component. The energy consumption when the device is in several positions
By adding the context-based optimization component, the gain in terms of power is evaluated at 30 % in comparison with the standard OS policies. In the following subsection, we report the results of our experiments conducted to evaluate the performance of the user needs-based optimization component.
5.3 Scenario prediction and application classification
The experimental results are based on the generated applications sequences from six users. These constitute a first test to validate the feasibility of the solution. In this section, for each user, we present the prediction application scenario and the applications classification. Finally, we present results about the obtained gain with our component in comparison with the standard energy management provided by the OS. For each user, we have the predicted sequence with the background processes, the time spent in each application and its classification in terms of Wi-Fi and CPU need. In order to demonstrate the difference in users’ behaviors and in the launched applications as a function of the week day, we selected six scenarios as shown in Fig. 15. Applications in green represent the background processes, and the foreground applications are in gray. The red lines on the applications represent the supposed beginning of the resources adjustments for the next application. It represents the remaining 10 % of the current application. Prior to evaluating the efficiency of the proposed idea, we first classified the different applications for each user. We use the information captured during 2 weeks to classify these applications like mentioned in Section 6. Table 5 shows the classification in terms of CPU need. The class value “L” represents the lowest class, “M” is the medium one, and “H” is the highest class. A first look at Table 5 shows the behavioral difference between the users who run the same application. For example, for user 1, Firefox is classified as medium while it is classified as low with user 3. This difference is due to way both users 1 and 3 interact with Firefox.

Users application sequences. Sequences in green represent background processes, in colors, foreground process
5.4 User needs-based optimization component evaluation (UNOC)
Experimental results show that our approach can reduce the whole energy consumption of the system by 33 % in comparison to what the OS allows. Figure 16 shows the impact of the proposed solution on energy savings over varying durations of usage for six users. The results show that the saved energy varies vastly from one user to another. For user 1 and user 2, the saved energy is by an average 8 and 5 %. For user 3 and user 4, the saved energy is more than 19 and 30 %. For user 5, the saved energy is about 22 %, and for user 6, the saved energy is 33 %. This variance is due to the difference of the running applications and the interaction manner of each user. For example, user 4 and user 5 run the applications 2048 and chrome, but energy saving for user 4 is higher by 8 % versus user 5. The reason is the difference of classes for Chrome and 2048 between the user 4 and the user 5. These results confirm that there is a considerable impact of the type of the running application for the power saving. The applications characterized by a less intensity workload, low connectivity need, and low interaction with user are the lowest in terms of power saving. This is illustrated with user 2 which runs VLC, FoxitReader, and Spotify. These applications have a reduced connectivity and computing need which limit the power reduction. In order to understand the impact of each application on the power consumption, Fig. 17 shows the power reduction for each application with the six users. A first look at the figure indicates that each application can impact the energy consumption. For example, Spotify is an application characterized by low CPU need, so the power reduced when this application is running is very low (around 2.5 %). However OneNote is an application which has the same characteristics as Spotify with the exception of the connectivity but yields an energy reduction of 7 % higher.

Energy consumption for each user

Total power saving for each application
We conclude that with an application characterized by a high CPU need, we can reduce an important amount of power. Imperial Sudoku, 2048, and Google Chrome are examples of such applications. We can also conclude that there is a relation between user interaction and power consumption by the application such as Google Chrome which reduces around 11 % when it needs low CPU performance. However, it reduces the energy consumption by over 23 % when it needs medium CPU performance. Figure 18 shows the percentage of the power reduction by the proposed approach. By analyzing the figure, we note that:
-
Power saving for the Wi-Fi is relative to the time spent in running a specific application. The gain in terms of energy reduction obtained by switching off the Wi-Fi interface is constant. By switching off the Wi-Fi interface, the whole power consumption of the ultrabook is decreased by 1.6 W.
Fig. 18 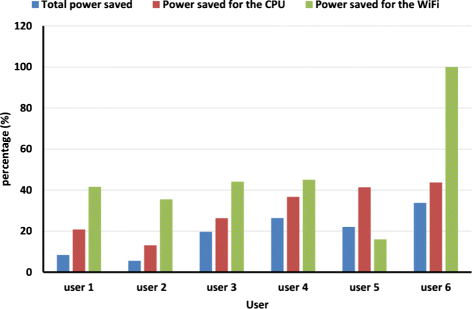
Total power saving with our approach
-
The total power reduction obtained by managing the CPU is relative to the running applications, the user behaviors, and interaction pattern as shown previously.

5.5 User needs-based component overhead evaluation
The cost of the in-line optimization is measured as the CPU, memory, and power consumption overhead. These measurements are presented in order to demonstrate that our solution based on ILs and ALs does not affect the system and does not cause performance degradation for the user, rather it allows the user to save his mobile system energy in comparison to what the OS would allow. The overheads are presented in Table 6. The user needs-based optimization component overhead is negligible and requires only few seconds to run. The solution can be applied to actual tablets which consume on average 12 W or an iPhone 6 which consumes also 12 W [9].
We add some additional results in Table 7. The tests below shows the CPU frequency scaling for YOUTUBE and WORD, the CPU power consumption, the gain and the time spent in each case.
For Youtube: we do not have latency by using 30 % of the maximal frequency in comparison with using 100 % of the maximal CPU frequency. We also notice a gain of 14.34 % in terms of CPU power consumption.
For Word: with Word, reducing the CPU frequency by 70 % does not degrade the performance at all, while the gain is about 10 %. When the latency is null, this may presage a satisfied user.
6 Related work
There is a large body of work focusing on energy consumption optimization in mobile devices. However, very few of them use the changing dynamic users and application needs in the control of the different system resources. In this section, we present some of the existing works in energy consumption optimization for mobile systems at the application level. We mainly focus on the approaches that take into account user behavior and experience in energy consumption reduction. Finally, we highlight the main differences with our approach.
One of the first works in this area is [10]. The authors demonstrated the benefit to study real user activities to characterize power consumption and to control the development of power optimization. Their experiments on an HTC ARM-based mobile phone show important differences between users’ behaviors. The author demonstrated also that the CPU and screen are the most demanding components in terms of energy. For the screen, the total utilization time is dominated by a small number of long intervals, with a duration of about of 100 s.
Other works like [11] show the importance to study the user’s activities and behaviors to optimize power consumption in mobile systems. Theses studies demonstrated the correlation between energy consumption of a mobile system and user actions. In [12], the authors proposed an approach which takes into account the user experience to apply different power optimization techniques. They developed a new cpufreq governor. Their dynamic clock scaling approach provides a mechanism to change the clock speed of the CPUs at run-time. Their proposed cpufreq governor analyze the user perceived response time of the applications at run-time. Then, this information is used to control the processor CPU frequency. The CPU energy consumption is reduced by up to 65.5 % over the Android’s default on-demand [13] cpufreq governor. The authors also exploited the characteristics of user/system interactions to minimize energy consumption. They used the elapsed time between two consecutive interactions to decrease the screen brightness during this interval in order to have a gain in terms of the whole system energy consumption. Authors in [14, 15] proposed user activities and context information-based technics and several management policies for each component. In their approach, the CPU frequency was adjusted dynamically depending on the workload. They also proposed to reduce background process life time depending on the obtained patterns. An energy consumption reduction of up 20 % in comparison with commercial solutions like JuiceDefender [16] has been obtained. However, their solution was not completely automatic and required modifications in the running application source code.
Some of the works use machine learning techniques to classify the applications or the user activities. Targeting the Wi-Fi consumption, the approach proposed in [17] makes a selection among the applications to give priority to those with the highest network interactivity level. The applications are classified as high or low priority according to network traffic data with the help of an SVM classifier. On this basis, only the traffic from high-priority applications is allowed in order to save energy. In [15], the authors proposed a classification of user activities in terms of screen brightness needs and correlate these data with the context information. Then, they used machine learning techniques to predict the required luminosity. CAPED improves the average satisfaction by 23.5 % compared to the default scheme. In [18], the authors presented the power monitor which is a client-server architecture developed to collect usage logs from Android powered devices. Based on the utilization patterns, power saving profiles are generated and are personalized to match the needs of each device in the system. The experimental results show that the power monitor can increase the battery life by almost 90 %. However, this solution has some privacy issues which are due to the exploitation of usage pattern generation. The survey part of [19] provides a useful list of studies concerned by recognizing human activities to save the energy of embedded and wearable sensing systems. Most of the listed studies use machine learning techniques, a large panel of different techniques. However, few of these studies predict future activities.
Compared to the previous works, our project presents the following main features:
-
The energy saving method includes more than one device. The management currently applies to CPU, Wi-Fi, luminosity, and GPS.
-
The framework for energy optimization is a modular architecture with the introduction of the ILs and ALs. This modularity along with the utilization of the Intel Energy Checker SDK makes our solution flexible. Adding a new input, for enhancing the optimizer by new data from a new sensor, or a new actuator for managing a new hardware component will be very easy.
-
Real-time adaptation is made according to predictions of next resources needs. Indeed, the energy management takes into account both the context and the user’s habits. In addition to the device context, the application context helps to predict the upcoming resource needs, provided that knowledge has been acquired about the application needs and the user’s frequent application sequences. Because abrupt modification can lead to user dissatisfaction, prediction of coming application requires to make gradual transitions.
-
The difference with the works achieved in [15] is that in CAPED, the authors focused on the user satisfaction and his visual perception to improve the brightness control model. Their main purpose is to improve the user’s average satisfaction with the display brightness. The energy consumption reduction is not the first parameter that they take into account. With the DHRM, we can reduce up to 30 % (as shown in experimental results) of the whole energy consumption. The use of sensors data is to determine when a state, for which the user will not be able to use his device, occurs. It prompts us to decrease the screen brightness to its minimal value. When the device is in a normal stand, we use the ALS to regulate screen brightness.
7 Conclusions
In this paper, two new techniques for energy consumption reduction in mobile systems have been proposed.
In the first solution, we use the current user context. In the current version of the work, the context corresponds to the system position, the ambient luminosity and the ambient noise. More information and sensors will be incorporated in the future. This approach allowed to reduce the energy consumption by about 30 % with a small overhead. The penalty of this first and light solution is only during the ILs and ALs deployment when the system is booted. It corresponds to 1 W during 2 s. There is no impact on memory storage or processing with this solution.
The second approach is more powerful than the first approach but requires additional overheads in terms of processing and storage. The second solution is based on data mining and machine learning techniques. In the paper, we demonstrated that our tools first allow new ILs for collecting data and ALs for controlling hardware elements can be easily added to the framework. At the opposite of the existing methods, where the user needs and behaviors are rarely taken into account, in our second solution, we not only take these elements into account but we also classify possible running applications, in terms of resources needs, and we predict the future applications. In comparison to the advanced energy management provided by windows 8.1, for some situations the gain offered by our approach reaches 30 %.
As perspective, we will consider more possible user patterns and more applications. User satisfaction level will be included as a parameter to control our energy-saving techniques. The prediction mechanism will be also developed to measure and increase the prediction accuracy. The off-line classification phase will be extended to include luminosity, sound level, and GPS needs. We can also improve DHRM by adding the mentioned parameters in [15], like battery level and per-user brightness references. For this reason, we will expand the use of IL and AL in order to exploit other sensors, such as compass and GPS and for other mobile platforms such as smartphones and tablets running Android/Linux and iOS. The algorithm used to learn the application sequences, namely GSP, was a first solution, but certainly not the most efficient one that can be found. We intend to select and implement a more recent and efficient algorithm (like in [20]), especially to improve the computing time that is dedicated to the maintenance and updating of the discovered sequences. Finally, as applications are likely to have multiple requirements at different application phases at run-time, it will be interesting to consider application phases within the application, rather than an entire application as a whole.
8 Endnotes
1http://uk.businessinsider.com/smartphone-and-tablet-penetration-2013-10?r=US&IR=T.
References
G Semeraro, G Magklis, R Balasubramonian, DH Albonesi, S Dwarkadas, ML Scott, in Proceedings of the 8th International Symposium on High-Performance Computer Architecture. HPCA ’02. Energy-efficient processor design using multiple clock domains with dynamic voltage and frequency scaling (IEEE Computer SocietyWashington, DC, USA, 2002), p. 29.
A Shye, B Scholbrock, G Memik, in Proceed. of the 42nd Annual IEEE/ACM Int. Symposium on Microarchitecture. MICRO 42. Into the wild: studying real user activity patterns to guide power optimizations for mobile architectures (ACMNew York, NY, USA, 2009), pp. 168–178.
CH Mooney, JF Roddick, Sequential pattern mining—approaches and algorithms. ACM Comput. Surv.45(2), 1–39 (2013).
R Srikant, R Agarwal, in Proceed. of the 5th Int. Conf. on EDT: Advances in Database Technology. Mining sequential patterns: generalizations and performance improvements (ACM, 1996), pp. 3–17.
Y Hirate, H Yamana, Generalized sequential pattern mining with item intervals. J. Comput.1(3), 51–60 (2006).
R Agrawal, R Srikant, in Proceedings of the 20th International Conference on Very Large Data Bases, VLDB. Fast algorithms for mining association rules in large databases (ACMSantiago, Chile, 1994), pp. 487–499.
Power Meter Yokogawa WT210. http://www.electro-meters.com/yokogawa/yokogawa-power-meters/wt210/. Accessed 2010.
Intel Energy Checker Software Development Kit UserGuide. http://www.greencodelab.fr/content/intel-energy-checker-tutoriel-0. Accessed 2010.
Device Power Consumption. https://www.gozolt.com/blog/power-devices-consume//. Accessed 2015.
A Shye, B Scholbrock, G Memik, PA Dinda, in Proceed. of the ACM SIGMETRICS Int. Conf. on Measurement and Modeling of Computer Systems. SIGMETRICS ’10. Characterizing and modeling user activity on smartphones: summary (ACMNew York, NY, USA, 2010), pp. 375–376.
C Bunse, in 28th International Conference on Informatics for Environmental Protection: ICT for Energy Effieciency, EnviroInfo 2014, Oldenburg, Germany, September 10-12, 2014. On the impact of user feedback on energy consumption (ACM, 2014), pp. 759–764.
W Song, N Sung, B-G Chun, J Kim, in Proceed. of the 15th Workshop on Mobile Computing Systems and Applications. HotMobile ’14. Reducing energy consumption of smartphones using user-perceived response time analysis (ACMNew York, NY, USA, 2014), pp. 20–1206.
V Pallipadi, A Starikovskiy, in Proceedings of the Linux Symposium. The ondemand governor (sn, 2006), pp. 215–230.
SK Datta, C Bonnet, N Nikaein, in Consumer Electronics (ISCE), 2013 IEEE 17th International Symposium On. Power monitor v2: novel power saving android application, (2013), pp. 253–254.
M Schuchhardt, S Jha, R Ayoub, M Kishinevsky, G Memik, in Proceed. of the 2014 Int. Conf. on Compilers, Architecture and Synthesis for Embedded Systems. CASES ’14. Caped: context-aware personalized display brightness for mobile devices (ACMNew York, NY, USA, 2014), pp. 19–11910.
Juice Defender. Applications for power consumption reduction.https://play.google.com/store/apps/details?id=com.latedroid.juicedefender&hl=fr. Accessed 2012.
AJ Pyles, X Qi, G Zhou, M Keally, X Liu, in Proceedings of the 2012 ACM conference on ubiquitous computing. SAPSM: Smart adaptive 802.11 PSM for smartphones (ACMNew York, 2012), pp. 11–20.
SK Datta, C Bonnet, N Nikaein, in Wireless and Mobile Networking Conference (WMNC), 2014 7th IFIP. Personalized power saving profiles generation analyzing smart device usage patterns (IEEEVilamoura, Portugal, 2014), pp. 1–8.
D Gordon, J Czerny, M Beigl, Activity recognition for creatures of habit. Pers. Ubiquit. Comput.18(1), 205–221 (2014).
B Zhang, C-W Lin, W Gan, T-P Hong, Maintaining the discovered sequential patterns for sequence insertion in dynamic databases. Eng. Appl. Artif. Intell.35:, 131–142 (2014).
Acknowledgements
The Authors would like to thank Intel Corporation and especially the Intel Research Council for the support given to the project and the tools.
Author information
Authors and Affiliations
Corresponding author
Additional information
Competing interests
The authors declare that they have no competing interests.
Rights and permissions
Open Access This article is distributed under the terms of the Creative Commons Attribution 4.0 International License(http://creativecommons.org/licenses/by/4.0/), which permits unrestricted use, distribution, and reproduction in any medium, provided you give appropriate credit to the original author(s) and the source, provide a link to the Creative Commons license, and indicate if changes were made.
About this article

Cite this article
Chaib Draa, I., Niar, S., Tayeb, J. et al. Sensing user context and habits for run-time energy optimization. J Embedded Systems 2017, 4 (2017). https://doi.org/10.1186/s13639-016-0036-8
Received:
Accepted:
Published:
DOI: https://doi.org/10.1186/s13639-016-0036-8